From the moment coal is first extracted from the ground to what remains after it is burned, it leaves a chemical footprint
The deeper I go into the subject of the coal industry, the more clearly I understand one unpleasant fact: its impact does not begin when coal is burned.
It begins much earlier—from the moment the ground is disturbed to extract coal.
To extract it, they expose coal seams, move enormous masses of rock, reshape the land and disrupt soils and water systems. The coal is then crushed, sorted, stored and transported. It produces dust and comes into contact with water and air. Along with it, substances that were previously held within layers of rock are brought to the surface.
Then the coal is burned. But its story does not end there either.
Ash, slag, waste-rock dumps, contaminated water and disturbed land remain. Some consequences can persist for years and decades. In some cases, the question has to be put more starkly: after several decades of mining, are we leaving behind processes whose consequences will be felt for far longer than our own lifetimes?
That is why, whenever I hear that coal is a cheap source of energy, I find it increasingly difficult to take the phrase seriously.
Cheap—if we count what?
Only the cost of extraction, transport and combustion?
What about the cost of the land that must later be restored? The water that has to be treated? The closure of old mines? Burning waste-rock dumps? The pollution that remains after mining ends? And who pays for the consequences ten, fifty or a hundred years later?
If those costs are simply left out of the price of coal, coal can indeed appear cheap.
But that is no longer the full price.
The more I study this subject, the more it seems to me that the idea of cheap coal rests on precisely this incomplete accounting. A large part of the price lies outside the payment for a tonne of coal or a kilowatt-hour of electricity—it is paid by the land, the state, the people who live nearby and those who will live there after us.
This time, therefore, I decided to look neither at open-pit mines nor at the owners of coal companies.
I decided to look inside coal itself.
But the second research pass made me look around it as well: at the soil that was removed; the rock exposed to oxygen and rain for the first time; the water that passed through a waste-rock dump; the tailings, ash and the mine after closure.
What is all this material made of? What happens to it when it is exposed, crushed, wetted, transported, processed and burned? Where do the substances captured by pollution-control systems go? What remains after coal? And how long does its chemistry continue to operate after the coal itself has ceased to exist as a fuel?
It seems to me that without answering these questions, it is impossible to answer another one honestly:
what does coal really cost?
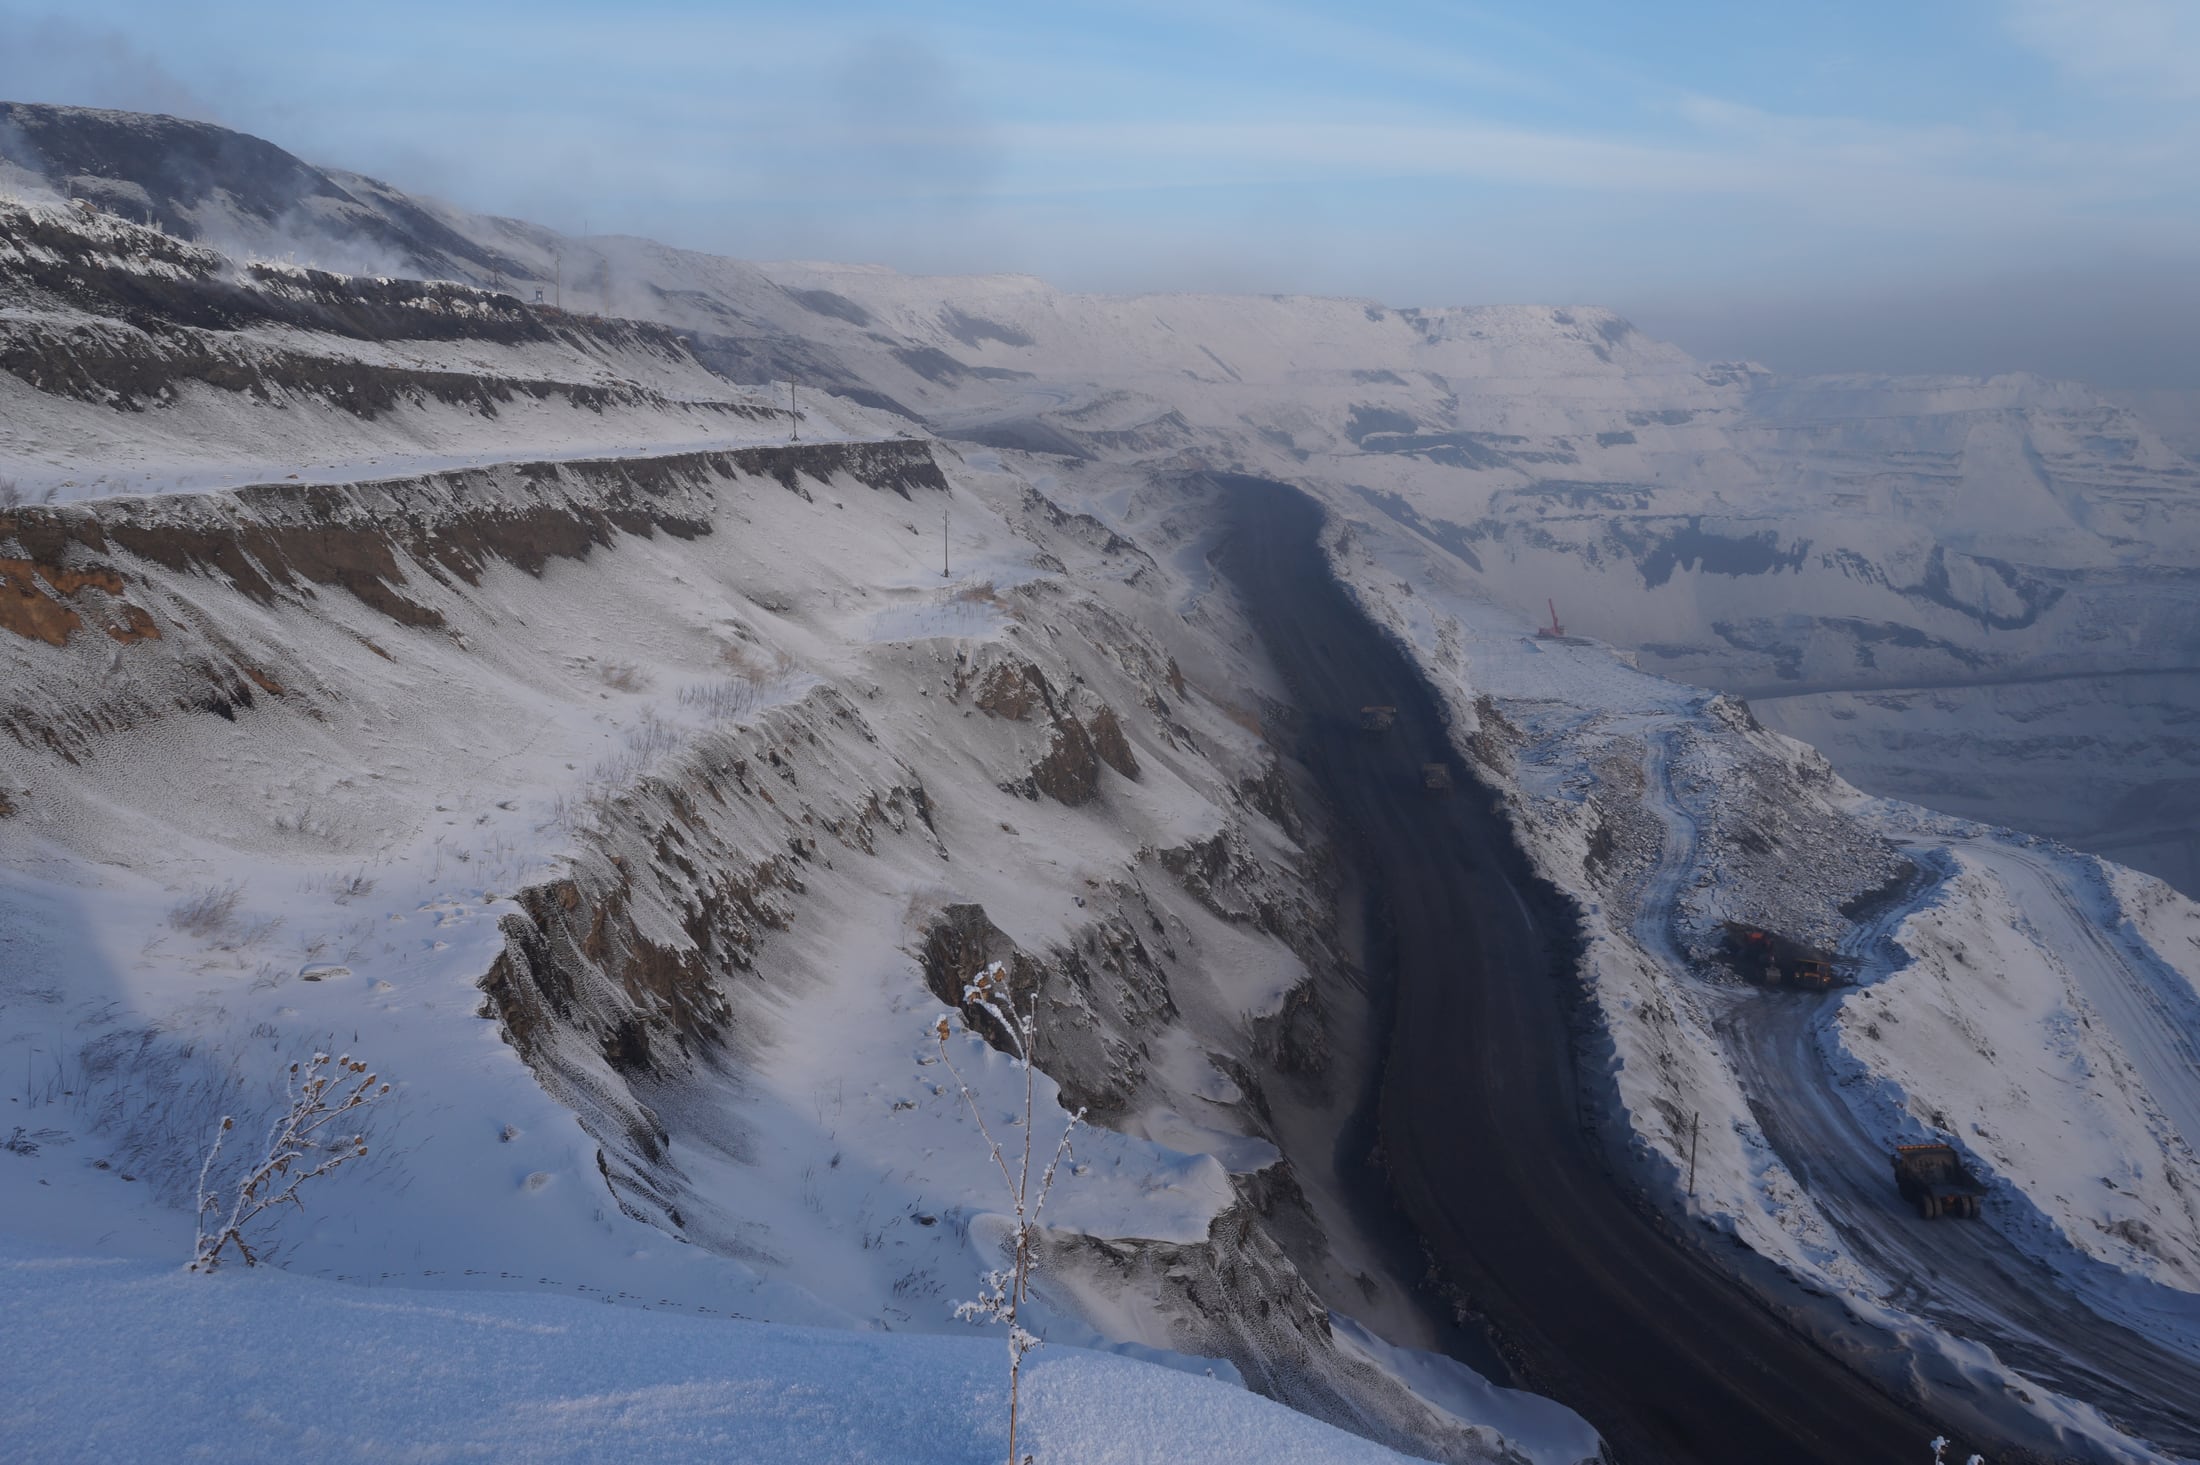 Enlarge ↗
From a list of pollutants to the movement of matter
The first research pass produced strong chains of evidence for dust, methane, nitrate, mine water, fires, combustion and ash. But it was uneven: air and several well-studied pollutants were more visible than the fate of the entire mass of rock, water and waste.
In the second pass, we changed the direction of the question.
Not only: what hazardous substance was found here?
But: what was in the ground, what did people expose, where did they move it, what did they transform it into, and where did it end up years and decades later?
A different map emerged:
geological rock → disturbed soil → overburden and waste-rock dumps → air and water → coal-processing tailings → combustion → fly ash, bottom ash, slag, gypsum and wastewater → closed mines and waste-storage sites.
At every transition, we tried to build an evidence chain:
source → substance or mixture → release → pathway → concentration or exposure → person or ecosystem → established effect.
If the chain ended at the source, we did not invent a disease. If a substance disappeared from the water, we checked whether it had moved into sediment. If pollution controls removed it from the flue gas, we asked which solid or liquid residue received it. If a reclaimed slope turned green, we did not automatically call it restored soil.
The second pass added 37 sources and 33 self-contained “claim—context—limitation” blocks to the first corpus of 90 sources and 66 such blocks. It did not overturn the main conclusion, but it made it more precise:
the coal industry moves enormous masses of geological material. During extraction, processing and combustion, the substances within that material move among air, water, soil, sediment, waste and living systems.
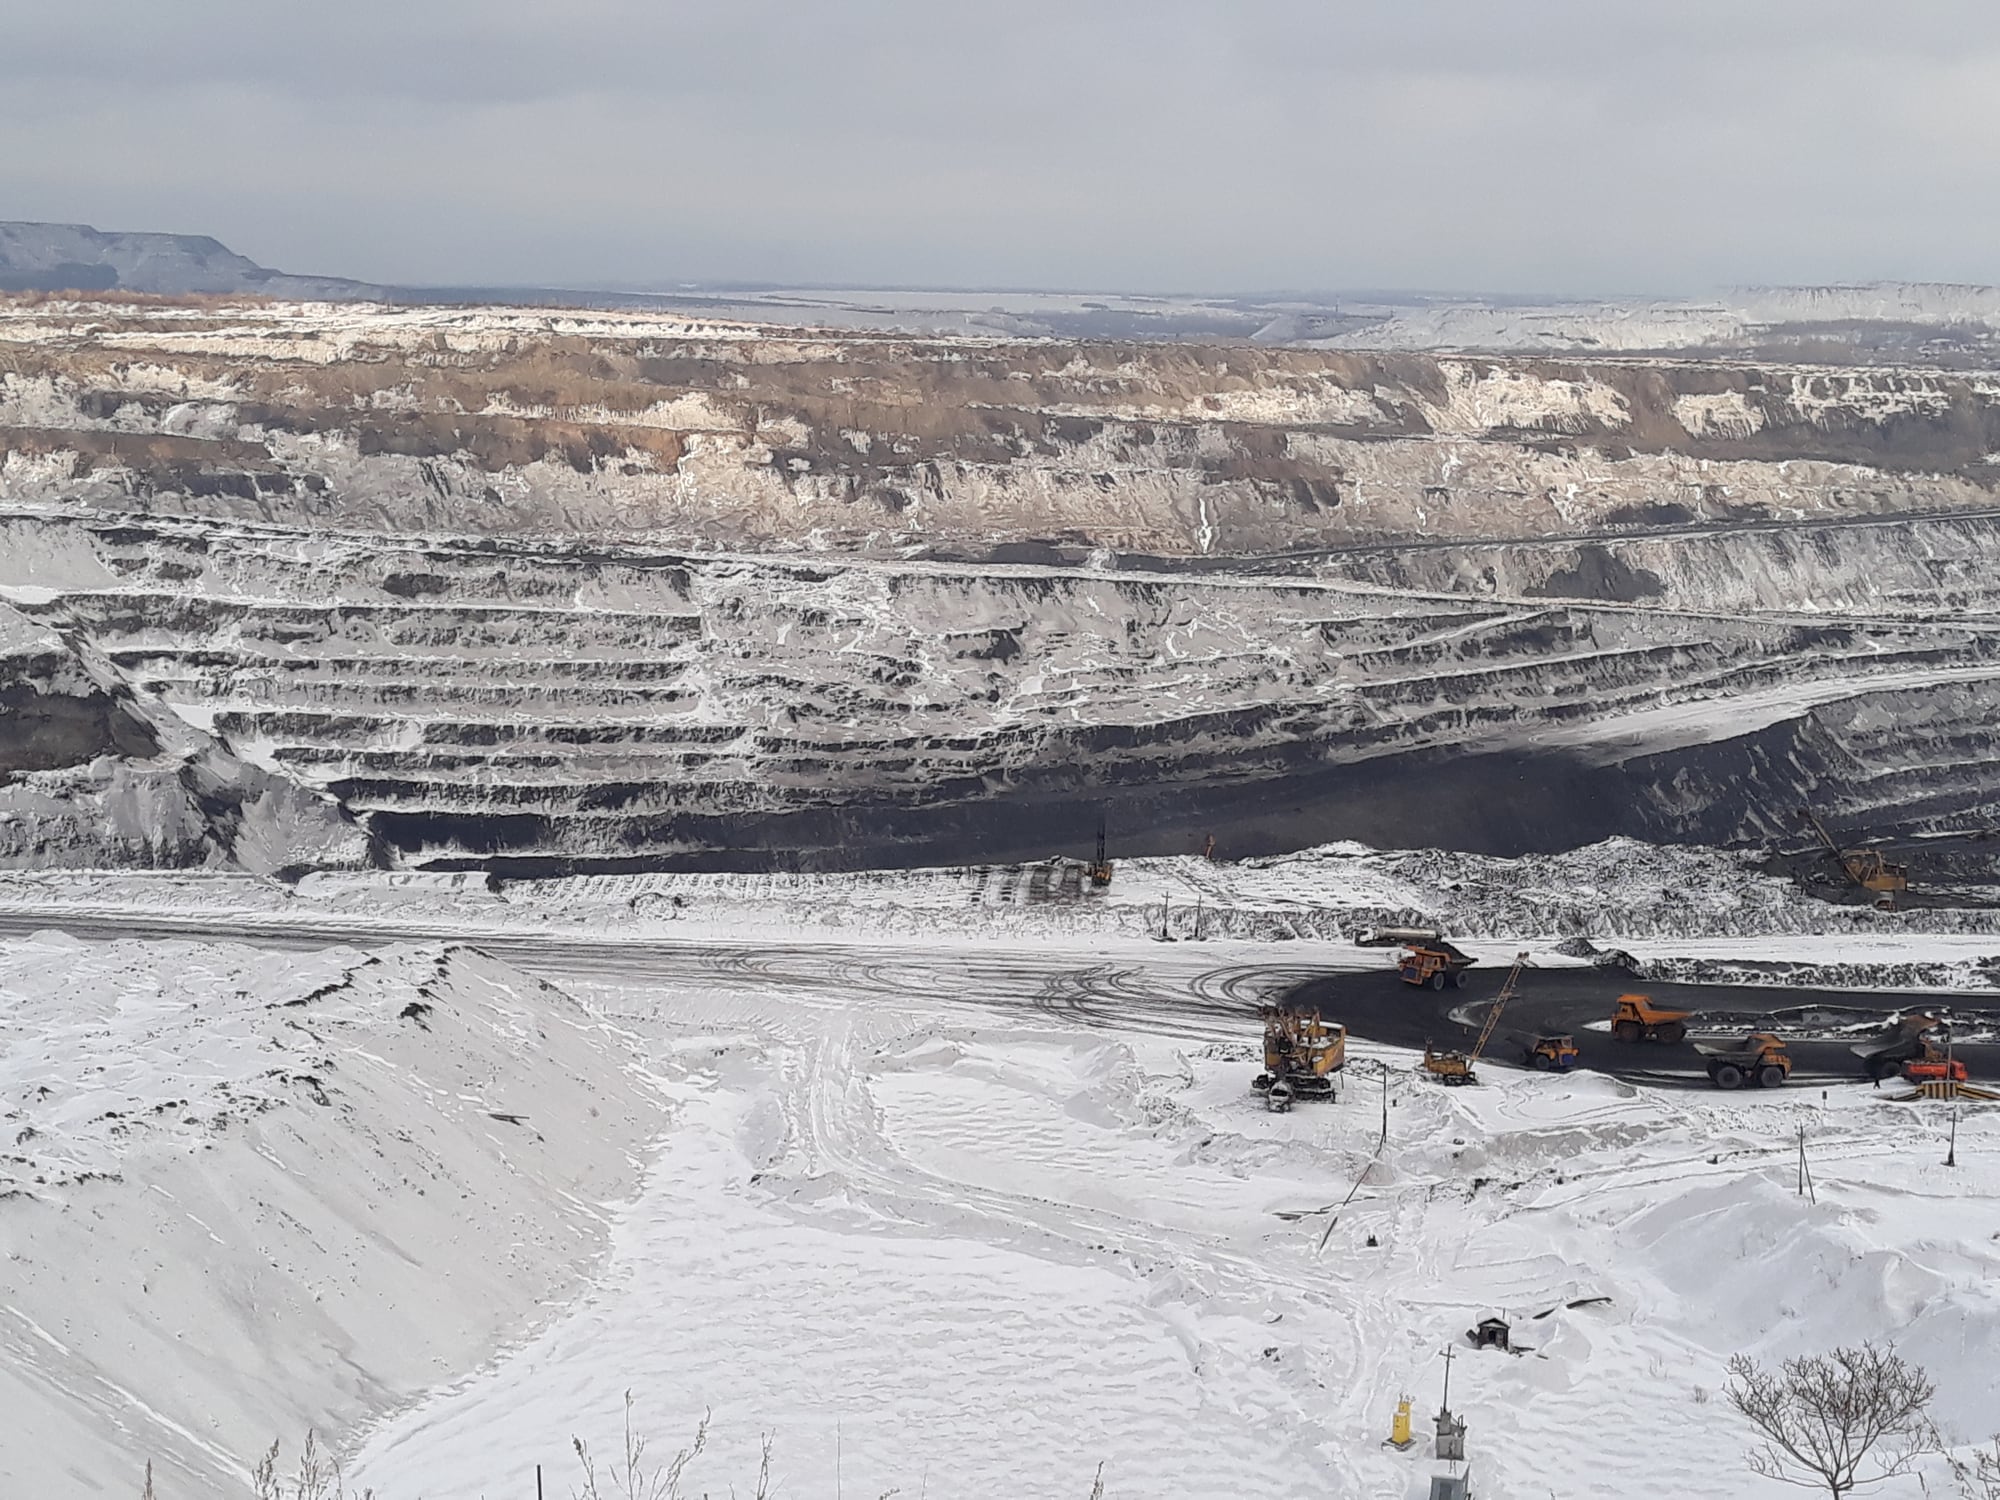 Enlarge ↗
Soil disappears first
Before the dust, smoke and ash, something simpler happens: to reach coal by open-pit mining, everything above it has to be removed.
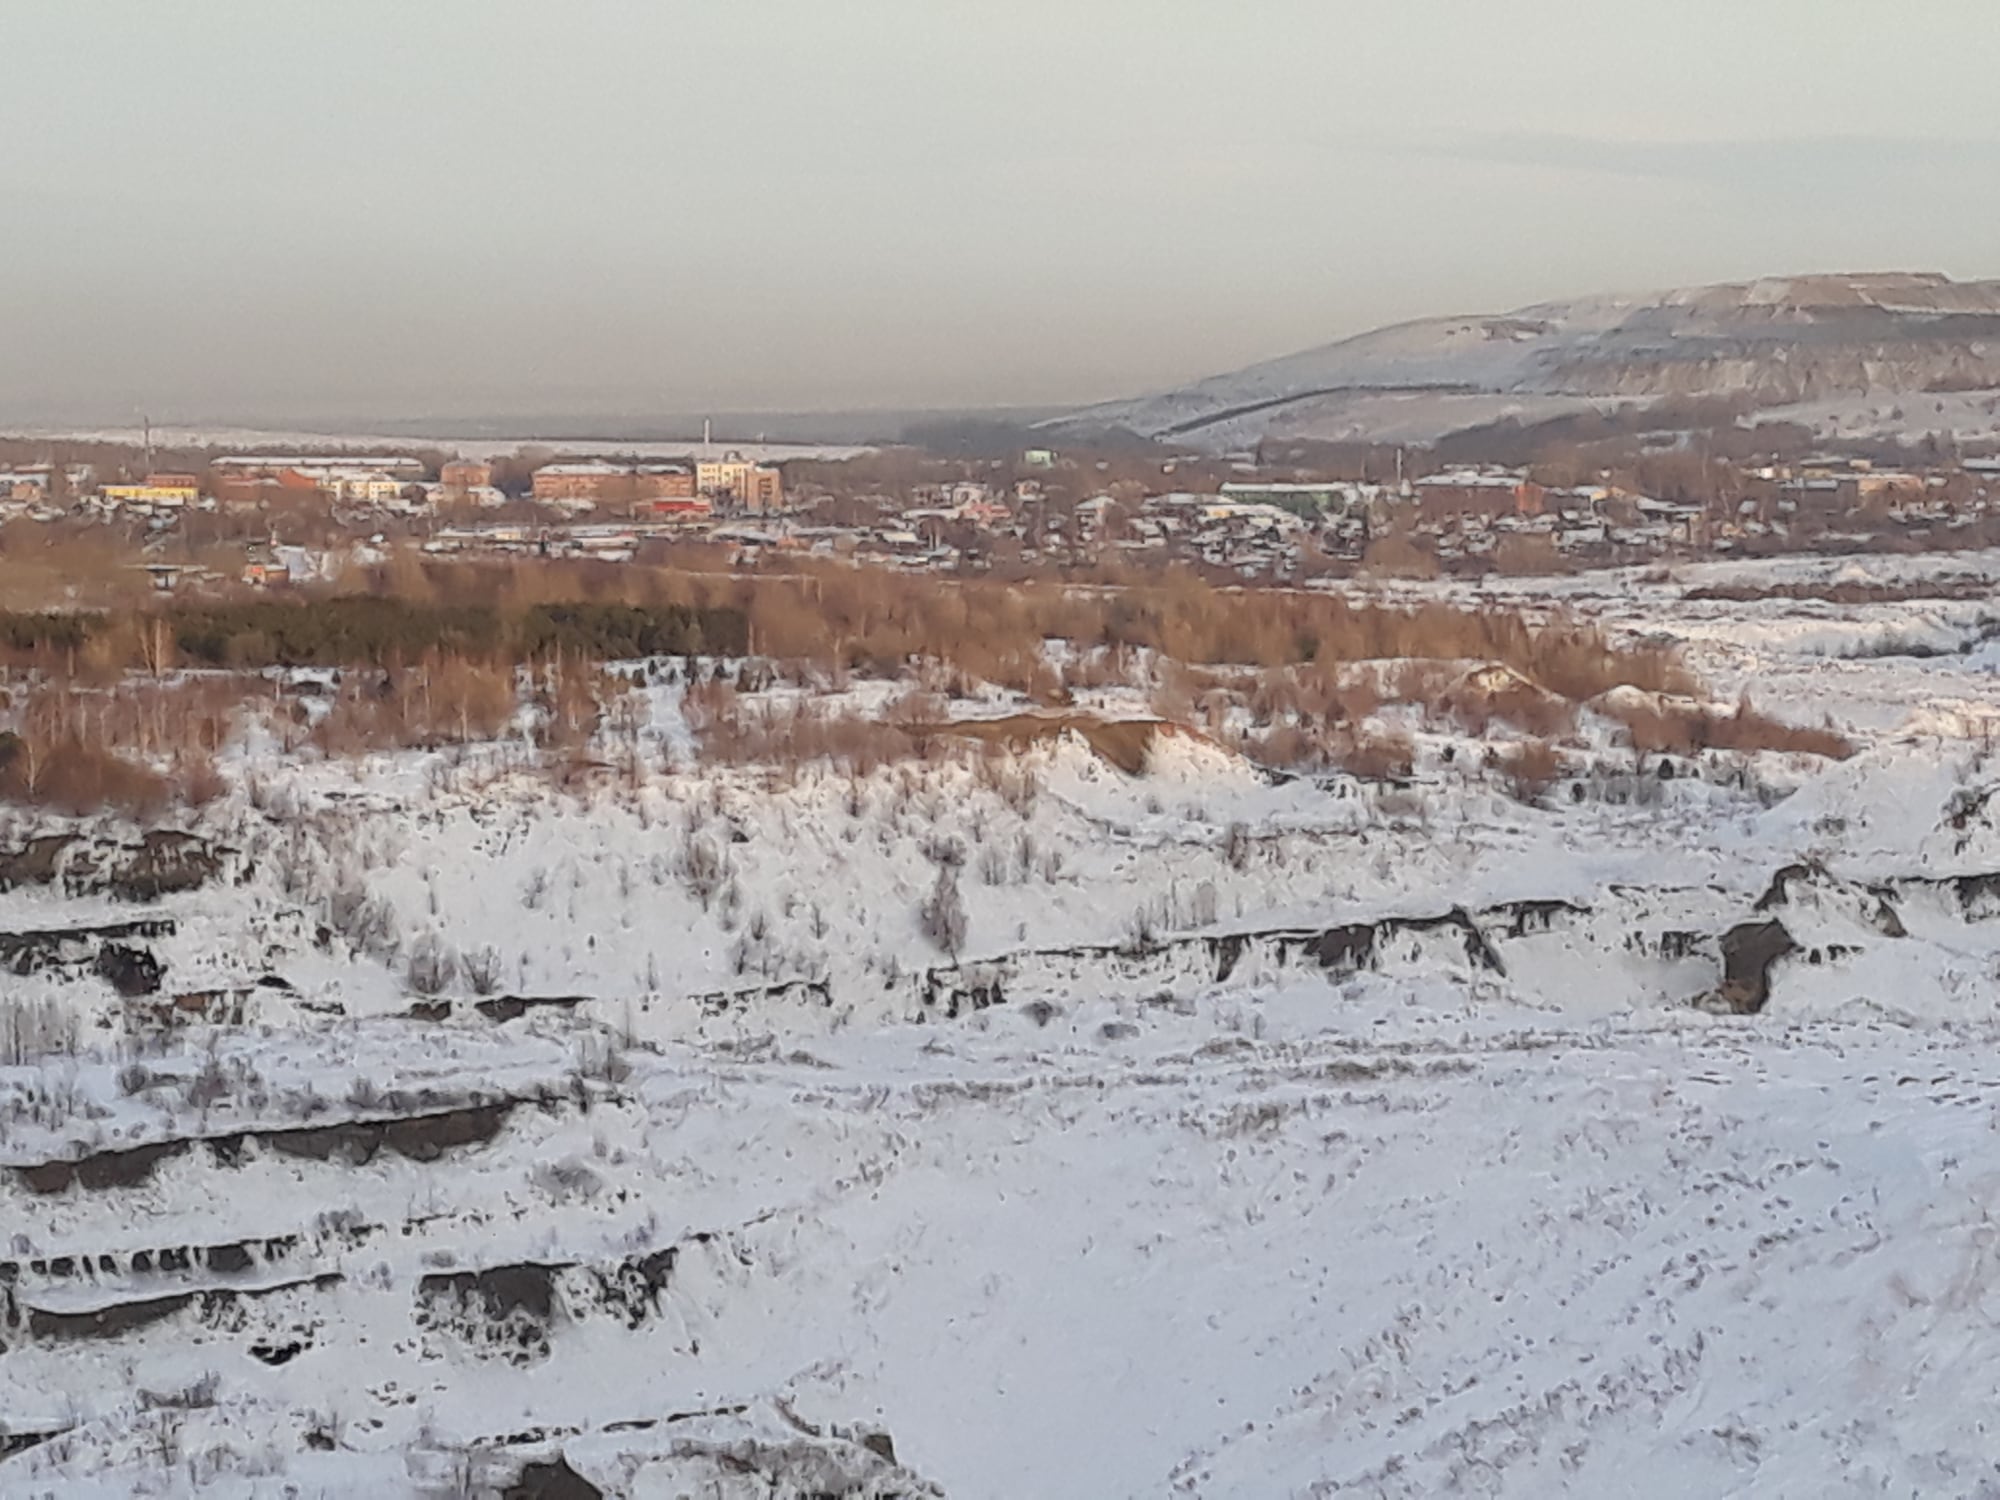 Enlarge ↗
Soil is not a brown layer of uniform composition. It has horizons, structure, pores, organic carbon, water, fungi, bacteria and invertebrates. Once the profile has been removed, stored, mixed with subsoil, compacted by machinery and then returned to a new landform, it cannot be reassembled like a dismantled cupboard.
Studies of reclaimed coal-mining land in different countries show not one rate of recovery, but several. Individual microbial functions and indicators may approach values at reference sites over years or decades. At the same time, community composition, soil structure, resistance to erosion, water retention and other functions may remain different. In an Australian study, 57 biotic and functional indicators followed different trajectories; the age of the reclamation alone did not turn the site back into the original system. In Wyoming and on China’s Loess Plateau, microbial and soil properties changed with age and land use, but whether something had “recovered” depended on the particular indicator selected. (Sources: CIC2-AU-SOIL-001, CIC2-US-SOIL-001, CIC2-CN-SOIL-001.)
This matters beyond science. A green slope is easy to photograph. It is much harder for a photograph to show whether the soil has regained its ability to retain water, support the local community and withstand a heavy rain without eroding.
There are also limiting results. In three coal-mining towns in Mongolia, overall soil contamination with Cd, Cu, Pb and Zn was low, and a simple relationship with distance from a mine was not confirmed. Proximity to a coal facility does not justify attributing every metal in urban soil to that facility. (Source: CIC2-MN-SOIL-001.)
But this null result does not restore the soil profile that was removed. It merely prevents us from replacing soil research with the convenient formula “everything near a mine is contaminated in the same way”.
A waste-rock dump is not a pile that simply sits there
Underground, overburden and surrounding rock existed under one set of conditions governing access to oxygen, water and microorganisms. At the surface, those conditions change. The material is broken up, pores and cracks appear, and air moves through it. Sulphides may oxidise, salts may dissolve, and iron, aluminium, manganese and other elements may change in mobility.
And rain falls on the dump.
Rain does not merely wet its surface. Some water runs off, carrying fine particles with it. Some penetrates the dump, contacts the enormous surface area of fragmented rock and emerges as leachate or enters the groundwater flow. If the waste mass contains pyrite, salts, residual coal, explosive residues or organic compounds, water becomes their means of transport.
That is why a dry photograph of a waste-rock dump tells us nothing about what will leave it during a downpour.
In the Elk Valley, water leached nitrate associated with explosive residues from waste rock; calculations indicated transport that could continue for decades. Organic compounds originating in coal waste were measured in waters from Polish coal-waste dumps. At Baganuur, some discharged waters met the applied quality criteria, but one interburden material had a pH of 3.29–4.26 and a high capacity to release sulphate and cobalt. One benign stream does not describe the entire mass of a site. (Sources: CIC-CA-N-001, CIC2-PL-DUMP-003, CIC2-MN-MAT-001.)
A burning waste-rock dump is more complex than an ordinary one. Heat does more than create smoke. It changes the rock itself, producing burnt zones, clinker, slag-like material and new high-temperature mineral phases. When water passes through this material, it encounters a different chemical system.
At the old Starzykowiec dump in Poland, prolonged combustion left a mineralogical signature that remained after the active phase. At the Fojo waste pile in Portugal, average total mercury content differed less between burned and unburned waste than the fraction extracted by the method used and regarded as more mobile: about 16% in burned material versus 8% in unburned material. This is not a human dose and not a universal characteristic of all dumps. But it is a good example of why a single total-content figure is not enough: heating can alter the form of a substance, and rain may then gain access to the more mobile fraction. (Sources: CIC2-PL-DUMP-001, CIC2-PT-DUMP-001.)
A waste-rock dump can produce dust, burn, release leachate, alter the soil beneath it and remain chemically active after operations cease. But there is no single lifespan for a dump. Some flows decline, some depend on precipitation and hydrology, and many sites simply lack observations across multiple environmental media.
The air people breathe near coal
Air remains an important part of the picture. It is simply no longer its starting point.
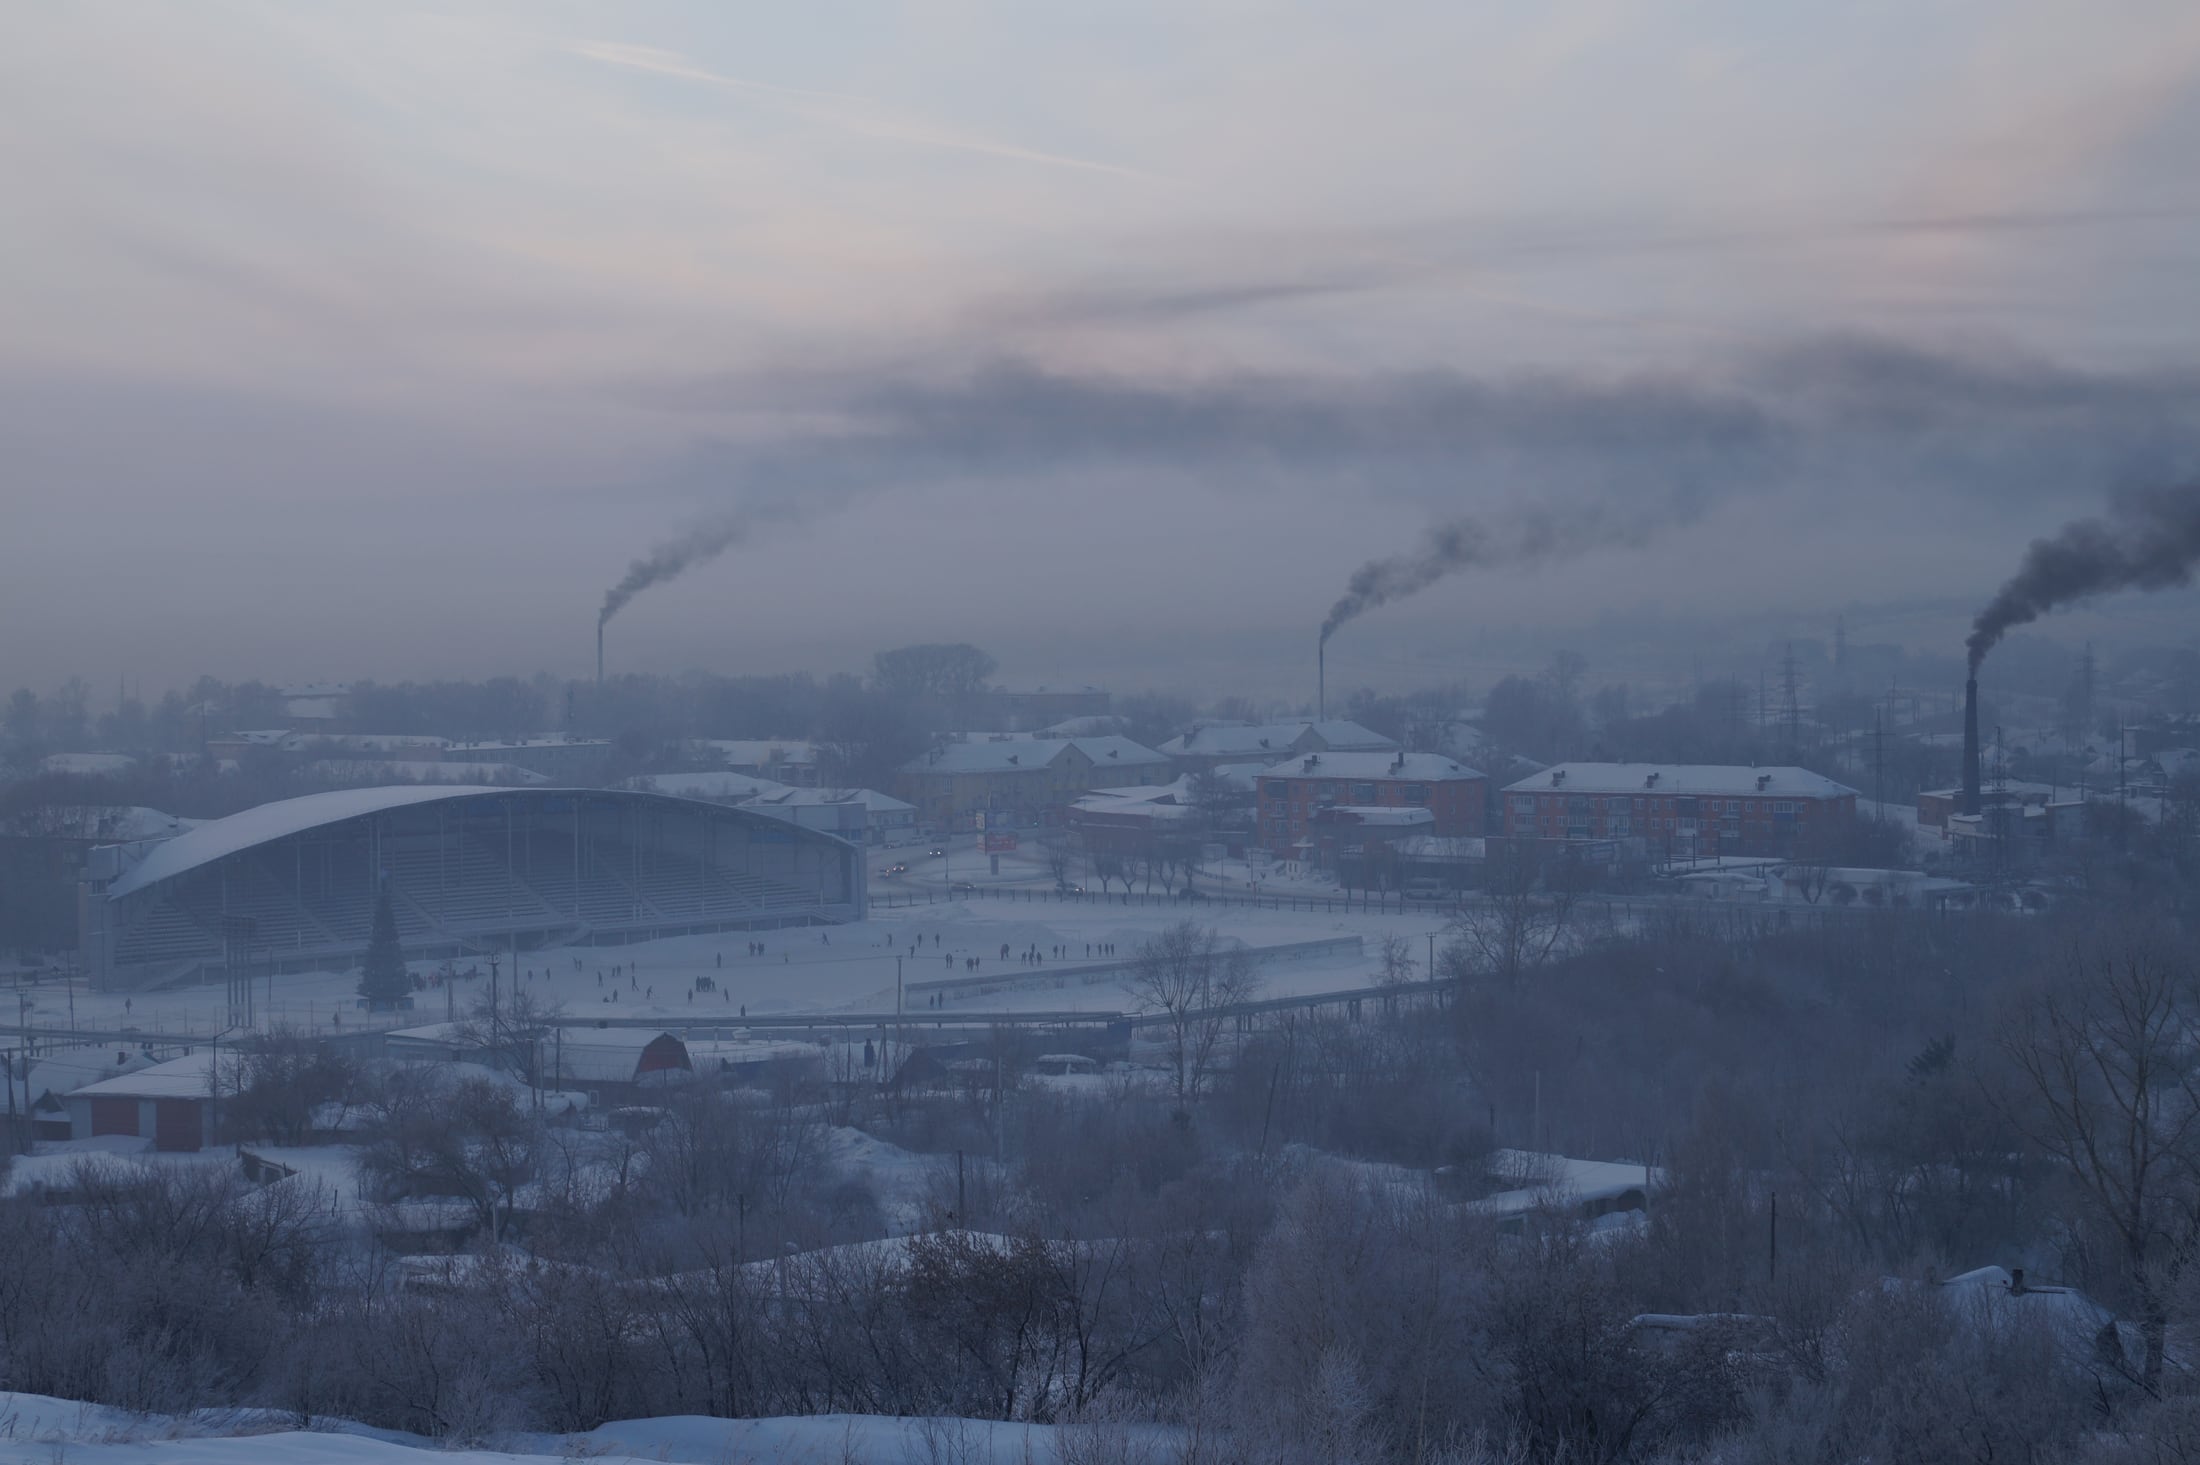 Enlarge ↗
The most complete human evidence chain concerns workers. Occupational coal-mine dust contains not only coal but mineral particles, including crystalline silica. Cumulative exposure is associated with pneumoconiosis, chronic obstructive pulmonary disease and impaired lung function. This is one of the strongest parts of the evidence map: there is a workplace environment, repeated exposure and clinical outcomes. (Source: CIC-US-DUST-001.)
For neighbouring communities, the chain is often shorter. Near an open-pit mine in Kuzbass, deposited particles, quartz, clay minerals and a spatial PAH signature were found in snow. But a snow loading expressed in µg/cm² cannot be converted into an air concentration or a personal dose. In Jharia, high PM2.5 and particle-bound elements existed within a mixture of active mining, transport, fires, road dust and meteorology. (Sources: CIC-RU-DUST-002, CIC-IN-AIR-001, CIC-IN-AIR-002.)
The honest conclusion is not that residents face no risk until everyone has been fitted with a personal monitor. It is this: the transport of mineral and coal dust exists, occupational harm is particularly well established, and the magnitude of residents’ external and internal dose has to be measured separately.
Gas without a stack: how an open-pit mine emits methane
Dust can be seen on snow. The eye does not see a methane plume over an open-pit mine.
An open-pit mine has no single ventilation stack on which a flow meter can be installed. Gas escapes across a large disturbed area, from exposed seams and rock, and varies with production, pressure and weather. It is therefore estimated using emission factors, ground measurements, aircraft and satellites—and each method has its own uncertainty.
At Australia’s Hail Creek mine, airborne campaigns using two independent methods produced comparable large fluxes: 14.0 ± 3.3 t/h in 2022 and either 9.6 ± 1.9 or 11.3 ± 5.3 t/h in 2023. Satellite observations of six Australian mines also indicated that a small group of sites may account for a disproportionately large share of the industry’s methane. Several campaigns do not show that the same emissions persisted during every minute of the year, and six super-emitters do not describe every mine. (Sources: CIC-AU-CH4-001, CIC-AU-CH4-002.)
Methane here is a separate climate pathway. A satellite plume is not a toxic dose to a resident. But a climate impact does not become unreal simply because it cannot be seen from the ground.
The blast ended; the nitrate remained
A blast lasts seconds. Its chemical footprint can travel with water for much longer.
In Elk Valley waste-rock dumps, isotopic and chemical evidence linked nitrate in blasted rock and drainage water to explosive residues. Field-scale flushing efficiency for the studied dump was estimated at 80–90%, and transport could continue for decades. In the long Elk River record from 1979 to 2022, flow-normalised nitrate concentration rose by 784% and load by 697%; in the paired Kootenay catchment without mining, concentration fell by 8.5%. (Sources: CIC-CA-N-001, CIC-CA-N-003.)
This is strong evidence of source and transport. But selenium, sulphate, hydrology and the scale of operations changed at the same time. Laboratory thresholds for individual organisms cannot automatically be declared evidence of field-scale harm to an entire river, and the operator’s 2023 monitoring did not identify nitrate as the principal cause of the observed community changes.
The evidence is not weak but uneven: we can see clearly how nitrogen leaves blasted rock. We see less clearly what share of each field effect was caused by nitrate itself.
Water does not carry everything away without a trace
The phrase “acid mine drainage” is familiar even to non-specialists. But water from coal facilities is not always acidic, and a neutral pH does not always mean good quality.
In one Pennsylvania stream, pH remained between 6.5–8, but iron hydroxide deposition near the discharge reached approximately 3 g/m² per day, while estimated fish biomass fell from 228 to 11 kg/ha. Iron precipitate altered the channel even without acidic water. (Source: CIC2-US-ECO-002.)
In West Virginia, deterioration in benthic macroinvertebrate communities accompanied rising ionic strength downstream of mountaintop-removal sites. In Indonesia, pit lakes at Tanjung Enim had a pH of 2.6–5.9 and sulphate concentrations of 868–2010 mg/L; treatment systems removed some elements effectively and others much less effectively. In South Africa, a severe downpour washed contamination from a mining catchment into the drinking-water supply of Carolina. (Sources: CIC-US-WAT-002, CIC-ID-WAT-001, CIC-ZA-WAT-001.)
Rain matters here again. It can dilute a concentration, or it can mobilise accumulated material and sharply increase the load. It is necessary to count not only mg/L, but also water flow, daily load, distance and sampling location.
And water is not necessarily the final stop. Iron, manganese, arsenic, selenium and particles of coal and ash may settle on the bed. In Huff Run, the mineralogy of contaminated sediment changed with the hydromorphology of the channel; pore water and the solid phase formed a heterogeneous system. The disappearance of a substance from the water column may mean not purification, but transfer into bed sediment. During a new flood, or following a change in pH or Eh, sediment may sometimes become a secondary source—but this must be demonstrated at a particular site, not declared the universal fate of every river. (Source: CIC2-US-SED-001.)
Coal processing: where does everything removed from the coal go?
After extraction, coal is crushed, sorted and processed. The saleable coal becomes cleaner, but the separated mineral fraction does not disappear. It moves into slurry, tailings and process water.
At two Indian washeries, suspended solids and Mn entered the water, while As, Se, Hg and Cd were not detected in it under the studied conditions. In the Chinese Kailuan process, substantial shares of some elements were redistributed into coal-processing waste; strong enrichment of arsenic in the tailings was reported. A complex mixture of inorganic and organic components was measured in slurry samples intended for underground placement in West Virginia. (Sources: CIC-IN-WASH-001, CIC2-CN-BEN-001, CIC2-US-BEN-001.)
The composition of tailings does not in itself demonstrate a plume in groundwater. That requires analysis of leachate, flow direction, background and downgradient wells and, preferably, tracers. We found fewer complete field chains for normally operating storage facilities than analyses of the waste itself.
An accident is a different situation. In 2014, an MCHM/PPH mixture escaped from a tank into the Elk River and the municipal water-supply system. This was a documented storage accident with a real burden on people and the healthcare system. But it is not evidence of routine, continuous discharge of a reagent from every coal-processing plant.
Cleaner saleable coal often means not that impurities have disappeared, but that they have moved into a less visible stream.
Between the mine and the power station
At stockpiles, water passes through stored coal. Along railways, fine particles settle and are resuspended. In ports, coal reaches the water and bed sediment.
Runoff from two US stockpiles had a pH of 1.4–3.1 and high concentrations of Mn, Al, Zn, Fe and sulphate. In an Australian rail corridor, coal particles were present in deposited dust but did not dominate the total measured PM mass. In the Muara Berau ship-to-ship transfer area, coal fragments were found at all ten sediment-sampling stations, and some metals accumulated in plankton and fish—without an established adverse effect or measured human consumption. (Sources: CIC-US-STOR-001, CIC-AU-TRAN-001, CIC-ID-TRN-001.)
The same stage produces evidence chains of different lengths. In one place, acidic runoff has been traced. In another, coal is visible in dust but is not its main source. Somewhere else, material has reached sediment and tissue, but not a demonstrated effect.
When coal burns somewhere it was never meant to burn
An open-pit mine fire, an underground mine fire, a burning coal seam and a burning waste-rock dump cannot be described as one mixture. Their temperature, ventilation, geology and contact with water differ.
Hazelwood: a chain that reached health
The 2014 fire in the Hazelwood open-cut lignite mine near Morwell lasted 45 days. At the nearest monitoring site, maximum daily PM2.5 reached 731 µg/m³, and eight-hour CO reached 33 ppm. Researchers later reconstructed people’s locations and calculated individualised exposure.
Increases in modelled PM2.5 exposure were associated with subsequent respiratory hospital admissions and some pregnancy outcomes. For a number of other outcomes, no association was found; nine years later, most respiratory symptoms were not associated with exposure, although a signal for wheeze remained among some people with previously diagnosed asthma. Hazelwood is valuable precisely because it combines positive and null results. It permits neither “the fire caused everything” nor “nothing happened”. (Sources: CIC-AU-FIRE-001–CIC-AU-FIRE-005.)
Wuda: a large number at the source itself
At the Wuda coal-gangue hill, which had been burning for more than 50 years, 2,760 measurements at 46 gas vents gave a mean mercury concentration of 5,908 ng/m³, with a range of 1,022–31,750 ng/m³. This is strong evidence of emissions directly from a gas vent. But the concentration in the vent is not the concentration in residential air, an absorbed dose or a disease. (Source: CIC-CN-FIRE-HG-003.)
Centralia: more than the air above a burning mine
Centralia is often told as a story of smoke and an abandoned town. In reality, the underground fire created a system: heat altered rock and the surface, fractures carried gases and water, subsidence reshaped the terrain, and heated soil developed a different microbial and plant world.
Field studies found strong divergence in bacterial and archaeal communities between hot and unheated soils, followed by convergence as the soils cooled. But “convergence” was not a simple return to the former system: part of the apparent resilience came from inactive taxa waiting for suitable conditions. At a cooled site, pH remained lower than at the reference site—about 4.4 versus 5.9. (Sources: CIC2-US-CEN-001, CIC2-US-CEN-002.)
Rain played a part here too. In 2011, when precipitation reached about 185 cm, researchers documented nine new subsidence features and linked heavy infiltration to steam generation and subsidence above the hot zone. This was not simply “water washing dirt away”: water entered a heated underground system and became part of the physical mechanism of danger. (Source: CIC2-US-CEN-005.)
At the same time, year-long monitoring in 2006–2007 at three sites did not find generally high chronic concentrations of Hg, CO, SO₂, H₂S, suspended particles, As, Cd or Pb. A measurable Hg signal increased when the wind came from the fire zone, but mean values remained comparatively low. This negative result cannot be erased. Nor does it describe earlier years, local gas vents or the soil directly above the fire. (Source: CIC-US-FIRE-001.)
An acidic mine discharge in the Centralia watershed is real, but the second pass did not find sufficient tracing evidence to attribute it specifically to the fire rather than to the wider legacy of abandoned mines. Nor did we find a reliable primary basis for the often repeated exact phrase “it will burn for another 200 years”. Official materials confirm that the fire remains active and dangerous; its specific remaining duration has not been established. (Sources: CIC-US-WAT-003, CIC2-US-CEN-006.)
Centralia matters not because it necessarily has the highest air pollution. It shows how an underground fire simultaneously changes rock, soil, heat exchange, the water regime, the terrain and the possibility of living at the surface.
The power station: from the stack into the residues
When coal burns, its organic fraction is converted mainly into gases and heat. The mineral fraction and trace elements are divided among flue gas, fly ash, bottom ash, slag, flue-gas-cleaning products and wastewater.
Pollution controls can sharply reduce atmospheric emissions. This is a real achievement. But they do not destroy chemical elements.
At a full-scale US unit, the reported element-specific removal efficiencies across the electrostatic precipitator were about 88% for arsenic, 56% for selenium, 17% for mercury and 8% for boron. Wet flue-gas desulphurisation then removed more than 90% of the chloride, 77% of the boron, 76% of the mercury and 30% of the selenium from the gas stream entering it. About 90% of the FGD-removed mercury and 99% of the FGD-removed selenium were associated with gypsum; for boron and chloride, more than 99% were discharged from the coal-combustion process with the wastewater. This is one particular unit, not a universal configuration for every power station. But it clearly demonstrates a material balance: less in the stack means more in some other stream. (Source: CIC2-US-COMB-001.)
Distribution differed at other power stations, and the fate of Hg was not the same as that of As or Se. The statement “pollution control captures 99.9% of pollutants” is therefore incomplete unless it identifies the element and where that element went.
Ash, slag and gypsum: a residue begins a new life
Fly ash, bottom ash, boiler slag and flue-gas-desulphurisation residues (FGD residues) are not one material. They differ in particle size, mineralogy, the forms of their elements and the way they are managed afterwards.
The total content of a substance in ash is not the same as its mobile fraction. In 34 samples of Chinese fly ash, Hg concentrations were 30–870 ng/g, but only 0.000–0.110% leached under the conditions of the laboratory test. This result does not justify automatically converting total content into aquatic exposure. It does not describe other elements, field hydrology, erosion or dust generation. (Source: CIC-CN-ASH-001.)
At some ash ponds in the south-eastern United States, a combination of boron, strontium and isotopic signatures confirmed leakage into surface water and groundwater. At two Indian sites, by contrast, the presumed source of high water mineralisation proved to be associated mainly with domestic wastewater and brick production, while the contribution from ash ponds was low. Proximity is no substitute for hydrogeology. (Sources: CIC-US-ASH-003, CIC-IN-ASH-002.)
After the Kingston spill, selenium in fish was higher than at comparison sites, but did not increase over five years and did not exceed the thresholds considered in the study. After the Dan River spill, no increase in Hg was found in the invertebrates and fish studied. At seven US road sites using coal ash—18 monitoring points, some observed for more than ten years—the pathways studied produced no measurable deterioration in water quality. (Sources: CIC-US-ASH-004, CIC-US-ASH-005, CIC2-US-USE-001.)
This does not make ash safe by definition. Nor does it justify defining every use of ash as pollution. In concrete, a road, mine backfill and a wet ash pond, the material exists under different chemical and hydrological conditions.
The right question is not “does the ash contain arsenic?” but “what form is it in, does it leave the material, where does it travel, and what reaches the receptor?”
When the chain reaches a living system
In coal chemistry, it is easy to stop at concentration. But an ecosystem enters the chain when a substance becomes available to an organism.
Selenium from the Elk Valley was traced through the river network for more than 575 kilometres. It moved through water and the food web into tissues and eggs. Among trout eggs at an active-mining site, the highest concentrations coincided with the absence of viable offspring. In American dippers downstream of mines, selenium was elevated in water, the base of the food web, invertebrates, blood, eggs and feathers, but no significant reduction in clutch size or hatching success was found. (Sources: CIC-CA-SE-001, CIC-CA-SE-003, CIC-CA-SE-004.)
This is not a contradiction to be removed. It marks the limits of transferring a conclusion among species, life stages and effect endpoints.
The same caution is needed for reclamation. Plant cover can reduce some erosion and be useful. But reclamation grasses are not the return of a native community, and a green surface does not demonstrate the simultaneous recovery of soil, water and the food web.
Closure does not close the chemistry
A closed mine stops producing coal, but it does not become the geological system it was before. Water rises through the workings, changes its contact with rock, creates reducing and oxidising zones, and dissolves and precipitates substances. Sometimes the first discharge is particularly contaminated and concentrations then fall. A decline does not always mean that the flow has disappeared.
Across 32 abandoned mine-water discharges in Scotland, the most severe phase often occurred during the first decades; iron declined to a lower level, but a measurable discharge persisted. This is one of the rare records in which observations for individual sites extend beyond a century. (Source: CIC2-UK-WAT-001.)
In Poland’s Przemsza basin, the volume of mine water in 2023 was approximately 42% lower than in 1991, and the daily chloride and sulphate load fell from 534.8 to 480.1 Mg/day. But during drought, lower river flow coincided with an increase in conductivity from about 2,000 to 6,700 µS/cm. Less discharged water does not necessarily mean a lower concentration in the river. (Source: CIC2-PL-WAT-001.)
Flooded mines also create a new pathway for gases: dissolved CH₄ and CO₂ were measured in mine water in the United Kingdom, with their origin and quantity depending on geology and hydrochemistry. This is not the return of former ventilation emissions, but a new post-closure system. (Source: CIC2-UK-WAT-003.)
In Kuzbass, water in the flooded workings of the Severnaya mine retained reducing conditions and H₂S for more than ten years. At other sites, the background upstream of a discharge was already contaminated, so a downstream exceedance cannot automatically be attributed to the closed mine. In Germany, the signature of lignite mining was traced in the water and bed sediments of the Spree for tens of kilometres, gradually mixing with urban sources. (Sources: CIC-RU-WAT-001, CIC-RU-WAT-002, CIC-DE-WAT-001.)
“The harm lasts forever” would be a convenient and unsupported statement. What is established is different: some processes diminish, some change form, and some loads require monitoring decades after mining ends.
Where the right to draw a conclusion ends
An evidence chain has stages:
- a substance is present in coal, rock, a reagent or waste;
- it has been released or changed form;
- it has reached air, water, soil, sediment, food or another residue;
- external or internal exposure has been measured;
- an effect in a person or ecosystem has been measured;
- the relationship is supported by comparison, repetition and independent lines of evidence.
Not every chain reaches the sixth stage. That does not make the earlier links imaginary. But it prohibits presenting them as the final links.
The link between occupational dust and disease has been traced most strongly. Hazelwood reached modelled individual exposure and several outcomes. Wuda gives a very high Hg concentration directly at a gas vent, but not a dose to residents. At Centralia, heat, subsidence, soil change and the continuing fire are established, but a distinct modern groundwater-contamination plume caused specifically by the fire has not been established. For coal-processing tailings, composition is better known than long-term hydrogeological fate. For ash ponds, the evidence sometimes reaches groundwater, but rarely actual consumption and internal dose.
These stopping points do not turn the article into a defence of the coal industry. They show where harm has already been established and where industry, government and science still have a duty to measure what they have left unanswered.
What this study does not demonstrate
It does not demonstrate that every underground mine, open-pit mine, waste-rock dump and generating unit produces the same outcome.
It does not combine dust, methane, nitrate, selenium, acidity, metals, PAHs, ash and reagents into one notional “toxicity of coal”. They have different pathways and consequences.
It does not turn the presence of a substance into a dose, laboratory leaching into a field plume, a concentration in a gas vent into urban air, or a green slope into a restored ecosystem.
It does not treat neutral pH as proof of clean water, or disappearance from water as disappearance from the system.
It does not claim that pollution control is useless. Pollution control can sharply reduce emissions. But the ash, gypsum and wastewater then have to be followed.
It does not erase negative results: low soil contamination in the Mongolian towns studied; comparatively low mean air concentrations at three Centralia sites; no detected increase in Hg in biota after the Dan River spill; and no measured deterioration in water at several road applications of ash.
Nor does it calculate a single universal monetary price for coal. It shows which material consequences such a calculation would have no right to leave outside the account.
Coal has no final stage
Before this work, I imagined the coal chain almost as it is usually drawn: mine, railway wagon, power station. Beginning, journey and end.
Now I see it differently.
First, soil is removed and rock is exposed. What was underground encounters oxygen, microorganisms and rain. Water passes through a waste-rock dump, carries dissolved substances and particles, and enters streams, groundwater and bed sediment. Dust carries coal and minerals. Methane leaves the disturbed rock mass. Residual nitrogen from explosives remains long after the sound of the blast has vanished.
At the processing plant, the mineral fraction moves into tailings and water. At a stockpile, rain becomes runoff. On the road or railway, coal becomes deposited and resuspended dust. At a port, it enters sediment and sometimes organisms.
If a waste-rock dump burns, it changes not only the gases above it but the rock itself—the rock through which water will later pass again.
In the furnace, some elements become more volatile, some are captured, and some enter fly ash, bottom ash, gypsum and wastewater. At an ash pond or in reused material, another history of contact with water and air begins.
After closure, a mine fills with water and develops a new geochemical regime. It may weaken, but the calendar date of closure does not switch it off.
At every stage, the chemical burden changes form and address. Sometimes it remains near the source. Sometimes it travels tens or hundreds of kilometres. Sometimes the chain reaches a tissue, an egg, an ecosystem function or a human disease. Sometimes it stops earlier—and that, too, must be shown honestly.
The new pass did not give us the right to say that every site is equally dangerous. It gave us stronger grounds for a different conclusion:
across the coal-industry life cycle examined in this study, we found no chemically neutral stage: substances repeatedly change form, environmental medium or pathway.
Only for humans does coal end in the furnace. For chemistry, it continues.
The ElepiCup Method
This article was prepared with the document → AI → person scenario in mind. A reader may ask an AI to find a number, explain a conclusion or produce a brief summary. In this kind of reading, a correct fact can easily become separated from its unit, location, comparator and critical limitation—and thus become an incorrect answer.
ElepiCup—the Elephant in a Cup Method—is an experimental way of organising evidence so that an extracted fragment retains, as far as possible, the information needed to interpret it correctly.
The large source is the elephant. The small fragment received by the AI is the cup. The whole elephant will not fit inside it. But a piece of the elephant must not pretend to be the whole elephant—and at the same time, both the person and the AI should be able to tell from that piece that it is an elephant, not a crocodile.
That is why 5,908 ng/m³ remains beside the words “Wuda gas vent” instead of becoming urban air. 784% remains an increase in flow-normalised nitrate concentration, not an increase in disease. The 88% of arsenic captured does not become arsenic destroyed: the residue into which it moved remains beside it. And rain falling on a waste-rock dump does not become universal proof that every well is contaminated—the water pathway and the measurement are retained.
Author of the method: Natalia Zubkova. Sergey Nikolaevich Severin and Viktor Andreevich Svetlov participated in developing and applying the evidence architecture used in this study, but they are not authors of the Elephant in a Cup Method.
The effectiveness of ElepiCup has not yet been demonstrated. No claim is made to absolute novelty, worldwide priority or the status of an established scientific discipline. This is a separate experiment.
Sources and notes
The principal sources used directly in this web edition are listed below. The complete evidence base, search methodology, additional cases, tables and limitations are intended for the research PDF. A source supports only the conclusion beside which it is cited.
Open the principal sources for this web edition
CIC-US-DUST-001— NIOSH. Coal Mine Dust Exposures and Associated Health Outcomes, 2011.CIC-RU-DUST-002— Spatial Patterns of Dust Deposition and PAH Accumulation in Snow near an Open-Pit Coal Mine, 2026.CIC-IN-AIR-001— Spatio-temporal variation of air pollutants around the coal mining areas of Jharia Coalfield, 2020.CIC-IN-AIR-002— PM2.5-bound trace elements in a critically polluted industrial coal belt of India, 2021.CIC-AU-CH4-001— Insights into Elevated Methane Emissions from an Australian Open-Cut Coal Mine Using Two Independent Airborne Techniques, 2025.CIC-AU-CH4-002— Methane Emissions from Superemitting Coal Mines in Australia Quantified Using TROPOMI, 2021.CIC-CA-N-001— Nitrate release from waste rock dumps in the Elk Valley, 2017.CIC-CA-N-003— Growth of Coal Mining Operations in the Elk River Valley Linked to Increasing Solute Transport, 2023.CIC-US-WAT-002— Downstream effects of mountaintop coal mining, 2008.CIC-ID-WAT-001— Acid Mine Drainage in a Tropical Environment: Bukit Coal Mine, 2018.CIC-ZA-WAT-001— Contamination of the water supply to the town of Carolina, Mpumalanga, 2013.CIC-IN-WASH-001— Raw coal characteristics and effluent quality of Kedla and Rajrappa Washeries, 2005.CIC-US-STOR-001— Effects of coal pile runoff on stream quality and macroinvertebrate communities, 1985.CIC-AU-TRAN-001— Queensland Government. Western–Metropolitan Rail Systems Coal Dust Monitoring Program, 2013.CIC-ID-TRN-001— Distribution and density of coal spills and bioaccumulation factors at a ship-to-ship transfer area, 2026.CIC-AU-FIRE-001— Characteristics of an open-cut coal mine fire pollution event, 2017.CIC-AU-FIRE-002— Maternal exposure to fine particulate matter from a large coal mine fire, 2019.CIC-AU-FIRE-003— Maternal exposure to PM from a coal mine fire and birth outcomes, 2019.CIC-AU-FIRE-004— Long-term impacts of coal mine fire-emitted PM2.5 on hospitalisation, 2022.CIC-AU-FIRE-005— Most respiratory symptoms have resolved 9 years after the Hazelwood coal mine fire, 2026.CIC-CN-FIRE-HG-003— Mercury emission from spontaneously ignited coal gangue hill in Wuda, 2016.CIC-US-FIRE-001— Pennsylvania DEP. Centralia Mine Fire Mercury Study, 2008.CIC-US-WAT-003— USGS. Effects of Abandoned Coal-Mine Drainage in the Mahanoy Creek Basin, 2004.CIC-US-ASH-003— Evidence for Coal Ash Ponds Leaking in the Southeastern United States, 2016.CIC-US-ASH-004— Selenium bioaccumulation in fish at the Kingston spill site, 2014.CIC-US-ASH-005— Examination of mercury contamination from the Dan River coal ash spill, 2021.CIC-IN-ASH-002— Assessment of groundwater pollution from ash ponds around Koradi and Khaperkheda, 2015.CIC-CN-ASH-001— Leachability of mercury in coal fly ash from southwest China, 2022.CIC-CA-SE-001— Evidence of long-range transport of selenium downstream of coal mining operations in the Elk River Valley, 2024.CIC-CA-SE-003— Reproductive success and survival of westslope cutthroat trout exposed to elevated selenium, 2008.CIC-CA-SE-004— Bioaccumulation and effects of selenium from surface coal mining in an aquatic songbird, 2022.CIC-RU-WAT-001— Sulphate reduction in the underground horizons of a flooded coal mine in Kuzbass (in Russian), 2020.CIC-RU-WAT-002— Environmental consequences of mine closure in Kuzbass and their monitoring (in Russian), 2015.CIC-DE-WAT-001— Geochemical signatures of lignite mining products in sediments downstream, 2021.CIC2-US-SOIL-001— Soil Microbial Community Recovery in Reclaimed Soils on a Surface Coal Mine Site, 2012.CIC2-CN-SOIL-001— The development of topsoil properties under different reclaimed land uses in the Pingshuo opencast coal mine, 2017.CIC2-AU-SOIL-001— Temporal dynamics in biotic and functional recovery following mining, 2022.CIC2-MN-SOIL-001— The impacts of mining on soil pollution with metal(loid)s in resource-rich Mongolia, 2023.CIC2-MN-MAT-001— Environmental Sustainability of Open-Pit Coal Mining Practices at Baganuur, 2020.CIC2-PL-DUMP-001— Mineralogy and geochemistry of coal wastes from the Starzykowiec coal-waste dump, 2014.CIC2-PL-DUMP-003— Organic contaminants of coal-waste dump water in Poland, 2020.CIC2-PT-DUMP-001— Assessment of mobile mercury concentration in soils of the Fojo waste pile, 2024.CIC2-US-ECO-002— Impact of mine drainage on a mountain stream in Pennsylvania, 1978.CIC2-US-SED-001— Mineralogical and geochemical variation in stream sediments impacted by acid mine drainage, 2018.CIC2-CN-BEN-001— Migration and Distribution of Fifteen Toxic Trace Elements during Coal Washing, 2009.CIC2-US-BEN-001— Environmental Contaminants in Coal Slurry Intended for Underground Injection, 2015.CIC2-US-CEN-001— Divergent extremes but convergent recovery of soil communities at the Centralia fire, 2017.CIC2-US-CEN-002— Inactive bacterial taxa and perceived soil microbiome resilience after a multidecadal disturbance, 2024.CIC2-US-CEN-005— The effect of abundant precipitation on coal fire subsidence in Centralia, 2013.CIC2-US-CEN-006— Pennsylvania DEP. Centralia Mine Fire Resources, 2026.CIC2-US-COMB-001— Partitioning of Mercury, Arsenic, Selenium, Boron, and Chloride in a Full-Scale Coal Combustion Process, 2009.CIC2-US-USE-001— Water Quality Risk Assessment from Roadway Substructures Employing Fly Ash, 2016.CIC2-UK-WAT-001— Long-term changes in minewater discharges from abandoned coal workings in Scotland, 1999.CIC2-PL-WAT-001— Multi-Decadal Impact of Mine Waters in the Przemsza River Basin, 2024.CIC2-UK-WAT-003— Sources and controls of greenhouse gases and heavy metals in mine water, 2024.