Why I began this investigation
At a public hearing about yet another coal waste dump, I heard an explanation that stayed with me for a long time. I can no longer remember the company’s name or the exact date. But I remember the substance of what was said very well.
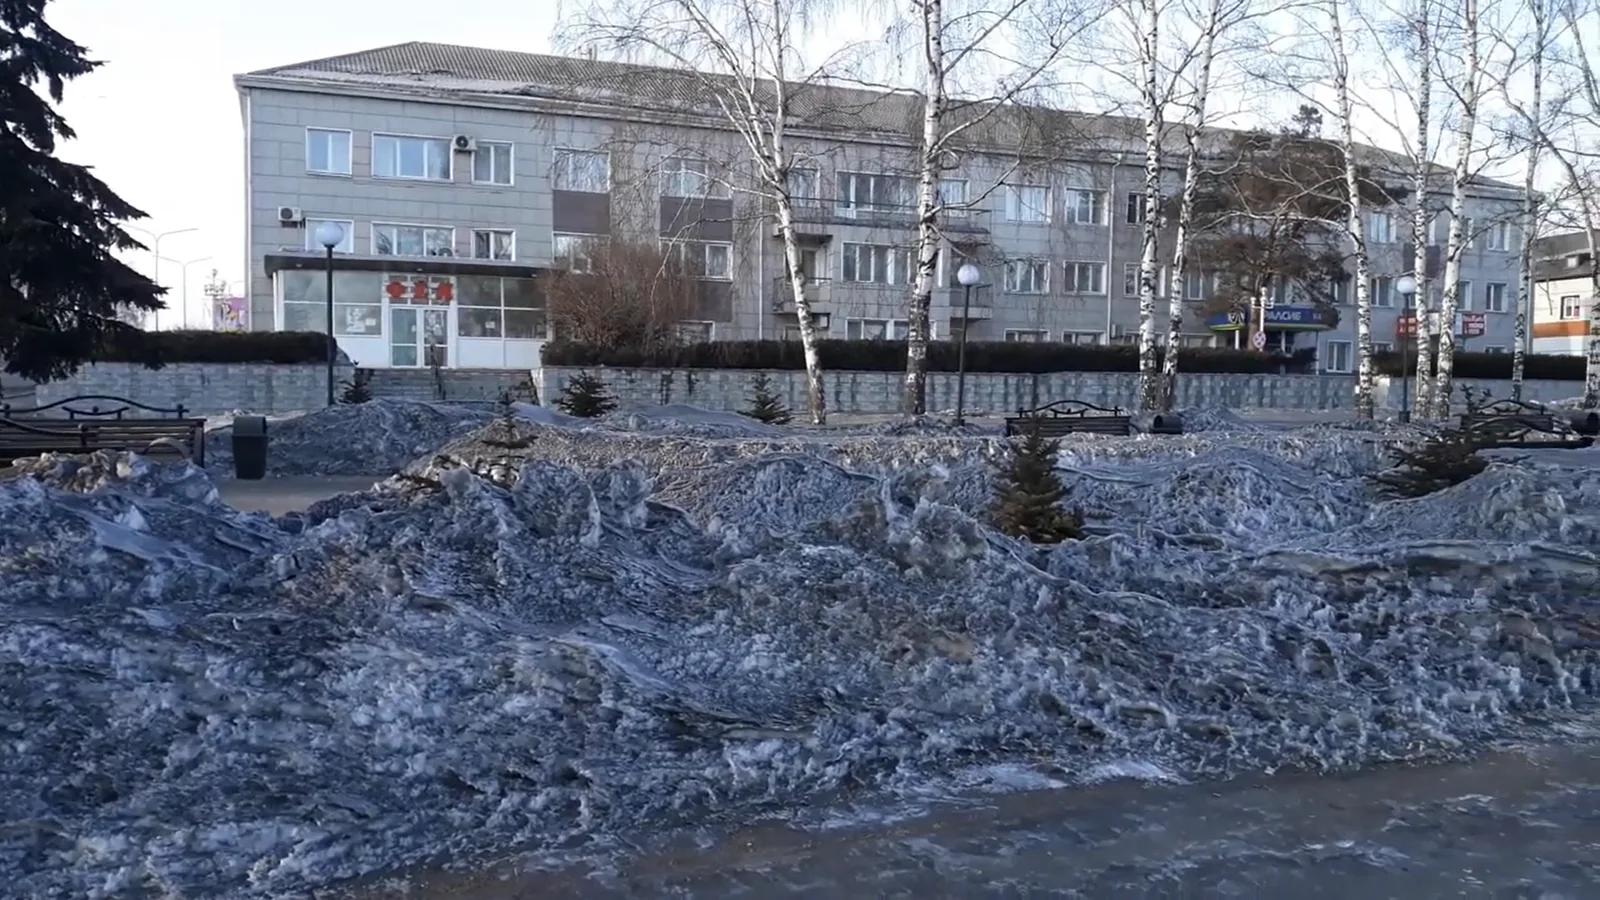
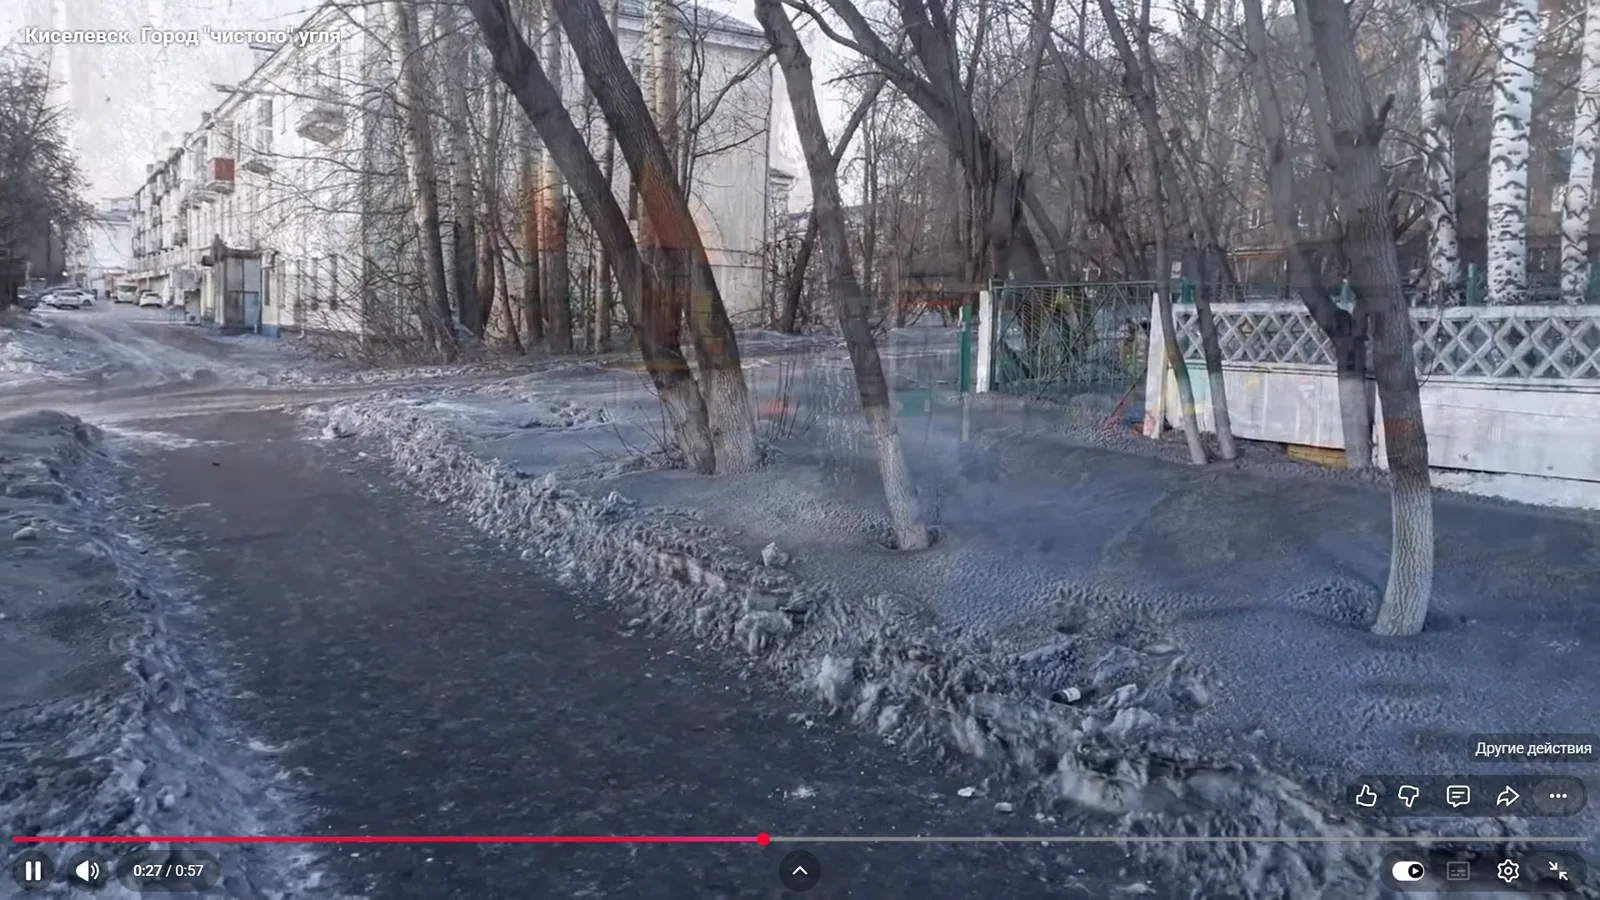
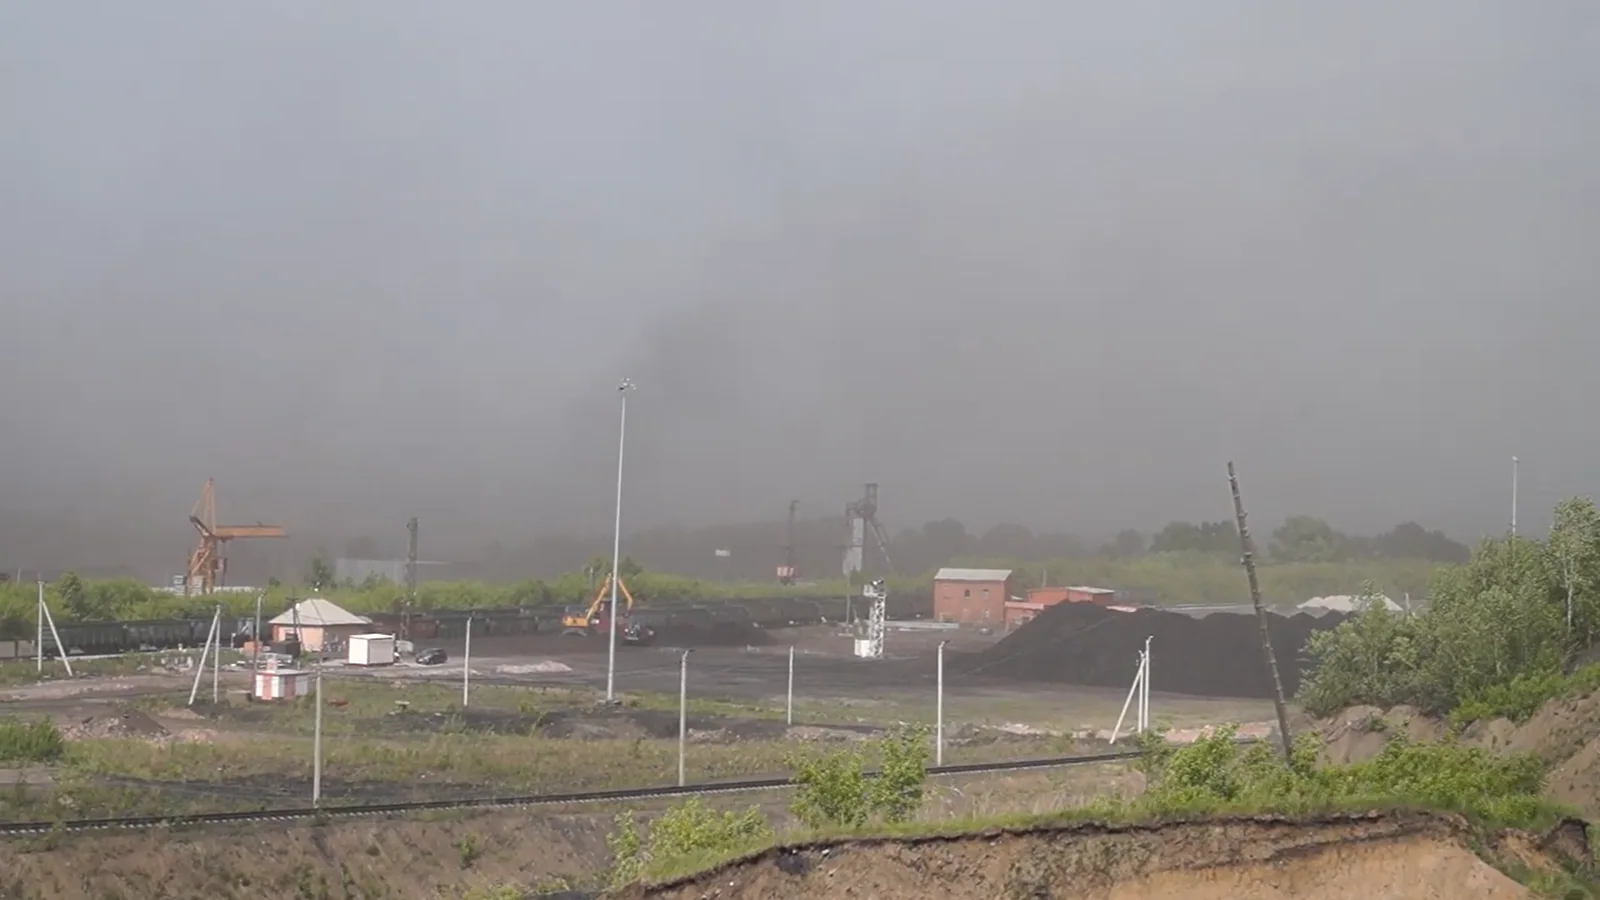
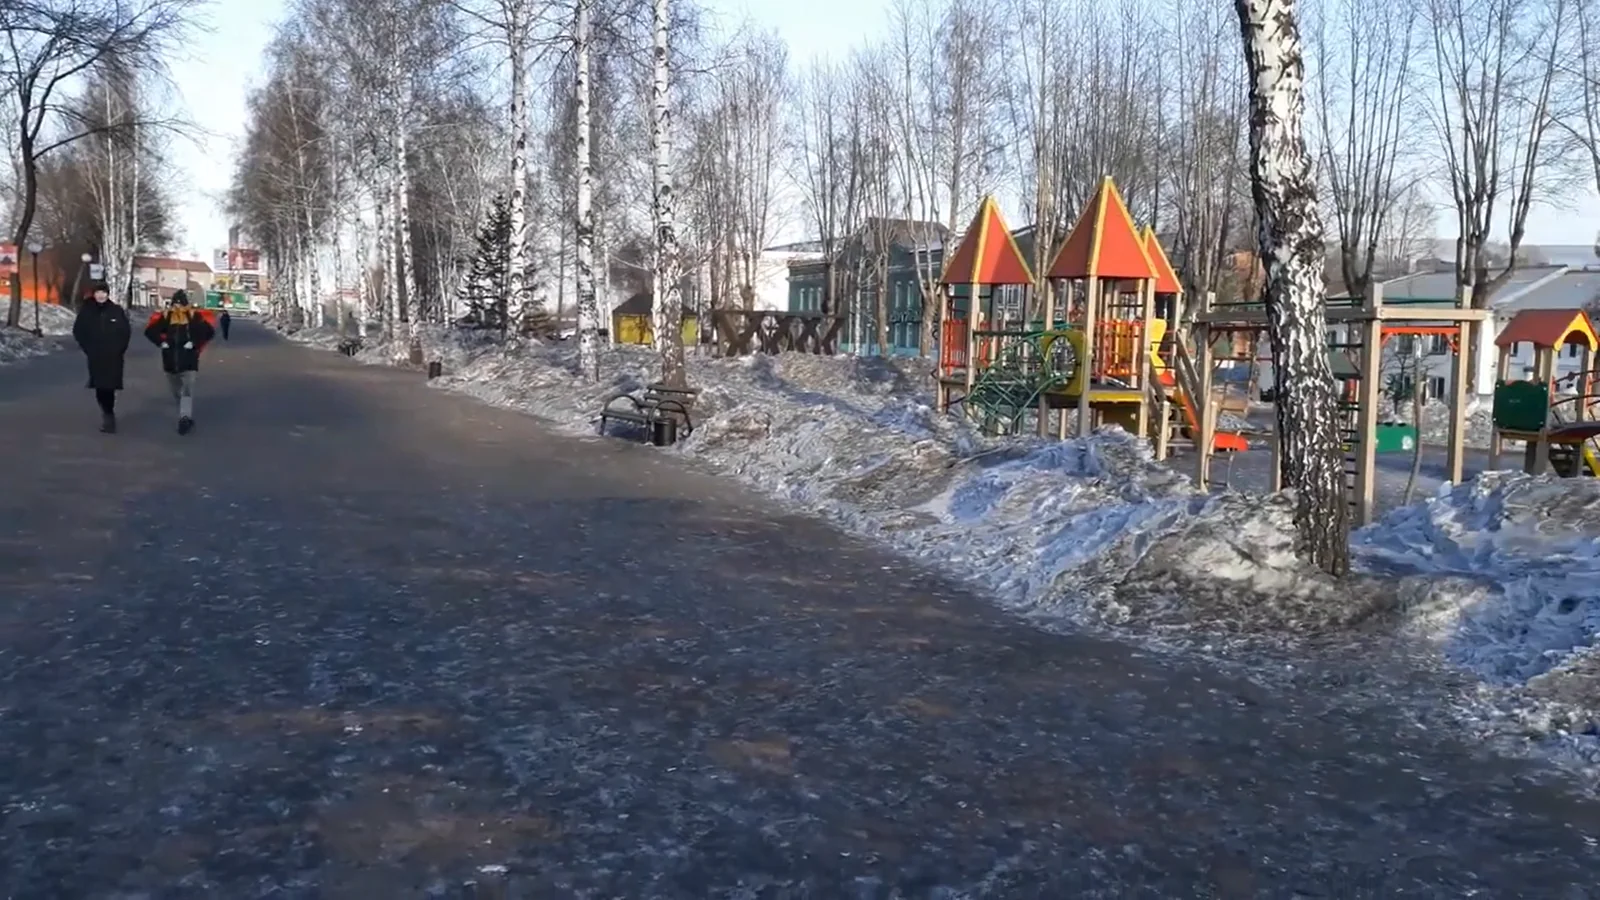
People were complaining about coal dust. Everything was black. They could not hang laundry outside to dry or take their children for a walk without worrying. One of the company executives replied, roughly:
— Why are you so worried? It’s only coal. You take activated charcoal when you are poisoned, don’t you? Coal absorbs all sorts of harmful things.
I wondered whether he really expected people to believe that coal dust was good for them. Did he think they would remember the tablets in their medicine cabinets and stop objecting to the air they had to breathe? He said it with such an earnest look that, for a moment, I even found it funny.
After the hearing, I went up to him:
— Do you take everyone for idiots? Do you think they don’t understand what you just said? This isn’t merely foolish. It is contempt for the people who have to live in these conditions.
He replied:
— If they don’t like it, they can leave.
But how were they supposed to leave? The operation had expanded right up to their homes, and the value of those homes had fallen. People could not sell them for enough money to buy somewhere else. And the company had no intention of buying them out.
That episode left me with a question: what exactly is so “beneficial” about the dust that residents of coal towns are told to endure?
Coal is not the only material released into the air during mining. Machinery is operating nearby. Rock is drilled and blasted. The material that is extracted is transported and crushed, and waste is piled up. Sometimes the dumps burn. What from all of this enters our lungs? What do we see on windowsills, snow and freshly washed laundry — and what can we not see at all?
I decided to investigate what lies behind the familiar phrase “coal dust”: what this pollution contains, what sizes the particles are, and what is known about their effects on people. I pay particular attention to ultrafine particles in this investigation, because I wanted to understand how much the visible black coating really tells us about the air we breathe.
The explanation given at the hearing confused two completely different things. Activated charcoal is a specially processed porous sorbent. In some poisonings, it is taken by mouth so that it can bind certain substances in the digestive tract and reduce their absorption. It does not help with every poisoning, and its medical use tells us nothing about whether inhaling coal dust is safe. According to a position statement by toxicology societies, activated charcoal is contraindicated when a patient’s airway is not protected.42
 Enlarge ↗
A particle smaller than a full stop
A nanometre is one billionth of a metre. Ultrafine particles are generally defined as particles smaller than 100 nanometres, or 0.1 micrometres.
A human hair is tens of thousands of nanometres thick. The upper size limit of PM2.5 — 2.5 micrometres — is 25 times larger than the accepted upper limit for UFP, which is 0.1 micrometres. This compares two upper limits; it does not mean that every PM2.5 particle is 25 times larger than every UFP. Many viruses fall within the same order of magnitude as UFP, although a virus and a pollution particle are entirely different things.
The difference between PM2.5 and UFP is not simply that one consists of “large” particles and the other of “small” ones. The categories are not mutually exclusive: ultrafine particles may be collected within the PM2.5 fraction, but a mass measurement of PM2.5 does not reveal how many of them were present. PM2.5 is also defined by aerodynamic diameter, whereas UFP may be separated in different studies by electrical mobility or other measured properties. These measures are related, but they do not always coincide.
PM2.5 is usually measured by mass. UFP is more often measured by particle number and size distribution. Imagine breaking one grain into a vast number of nanoparticles: the total mass would barely change, but the number of particles and their combined surface area would increase sharply.
Organic compounds, sulphates and metals may be present on that surface. The same microgram of aerosol can therefore have different biological activity depending on the particles’ size, composition, shape and solubility.
The result depends on the instrument. A counter that begins measuring at 2.5 nanometres will record more particles than one with a lower cut-off of 10 or 20 nanometres. Results from different studies cannot be compared without knowing the measured size range, dilution method and sampling conditions.
The WHO has not established a numerical health-based limit for UFP. Instead, it proposed good-practice guidance: measure particle number concentration, or PNC; state the instrument’s size range; and expand monitoring. As reference values, the WHO describes a 24-hour mean below 1,000 particles per cubic centimetre as low and above 10,000 as high; for a one-hour mean, a high level begins at 20,000. These are reference values for air monitoring, not statutory limits or thresholds of safety.1
Where they come from
UFP do not come only from coal.
They are produced by engines, aviation, shipping, metallurgy, welding, heating, cooking, candles and tobacco smoke. Nanoparticles also form during forest fires and volcanic activity. Some particles are emitted directly; others form in the air as gases cool, oxidise and condense.
A high reading alone is not enough to show where the particles came from. In an industrial city, a road, a boiler house, domestic heating, an oil refinery and other sources may all be nearby. Researchers have to separate their contributions.
To do this, they compare particle size, chemical composition and shape with wind direction and the operating times of industrial facilities. They then use models to help distinguish the contributions of different sources.
 Enlarge ↗
Coal’s path: from seam to stack
Mining
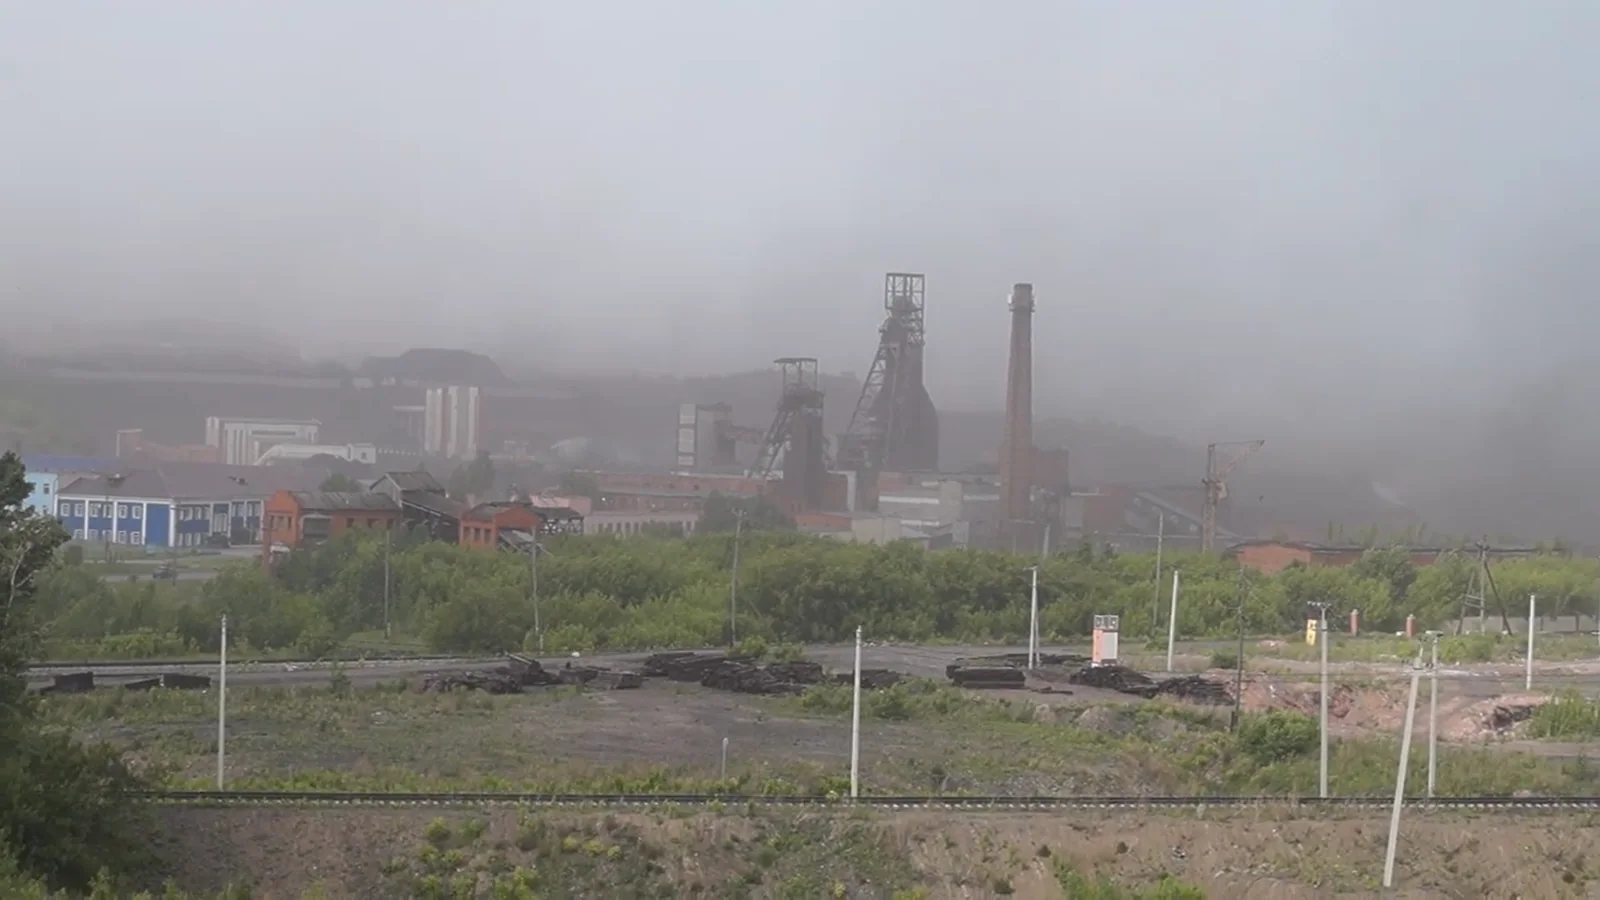
When rock is broken mechanically, most of the visible dust mass usually comes from larger particles. But a mine or open pit also has other sources of very fine aerosol: diesel engines, blasting, combustion and heated surfaces.
In an underground coal mine, US researchers measured diesel aerosol in the range of 5.6–560 nanometres. This directly confirms the presence of nanoparticles in the workplace air, but it does not show that all mine aerosol is coal-derived.2
For comparison, I examined a study of a modern underground chromium mine in Finland. It was not a coal mine, but many of the processes were similar: crushing, unloading, conveyor transport, blasting and diesel machinery. Particle numbers varied greatly between locations. The authors attributed a substantial share of PM1 mass to diesel emissions and, at some sites, to blasting.3 The instruments covered several size ranges, so the study provides an overall picture of fine particles in a mine rather than one universal value for UFP alone.
The study helps identify where very fine particles arise in a mine. It cannot be used to calculate emissions from every coal open pit; measurements are needed at the facility itself.
In Kuzbass, researchers isolated a fraction smaller than 0.1 micrometres from dust accumulated in snow near the Bachatsky, Novobachatsky and Permyakovsky open-pit mines and the Belovo power station. They examined its composition and effects on cells.45
This is valuable local evidence for our subject. But snow accumulates pollution over months. Such a sample shows what settled on the surface over a long period. Such samples do not establish how many UFP a person inhaled in a particular hour, nor do they by themselves distinguish the contributions of the open-pit mine, power station, machinery and other sources.
Blasting, crushing and coal preparation
A blast creates a cloud of mineral dust and gases. A crusher breaks up rock and coal. A coal preparation plant separates and moves material. All these processes produce dust. But rigorous, comparable studies measuring particles smaller than 100 nanometres specifically at coal facilities are much less common than studies of PM10 and respirable dust.
I therefore found no reliable universal estimate of how many coal-related UFP are generated by a single blast or by crushing one tonne of material.
Waste heaps, dumps and mine fires
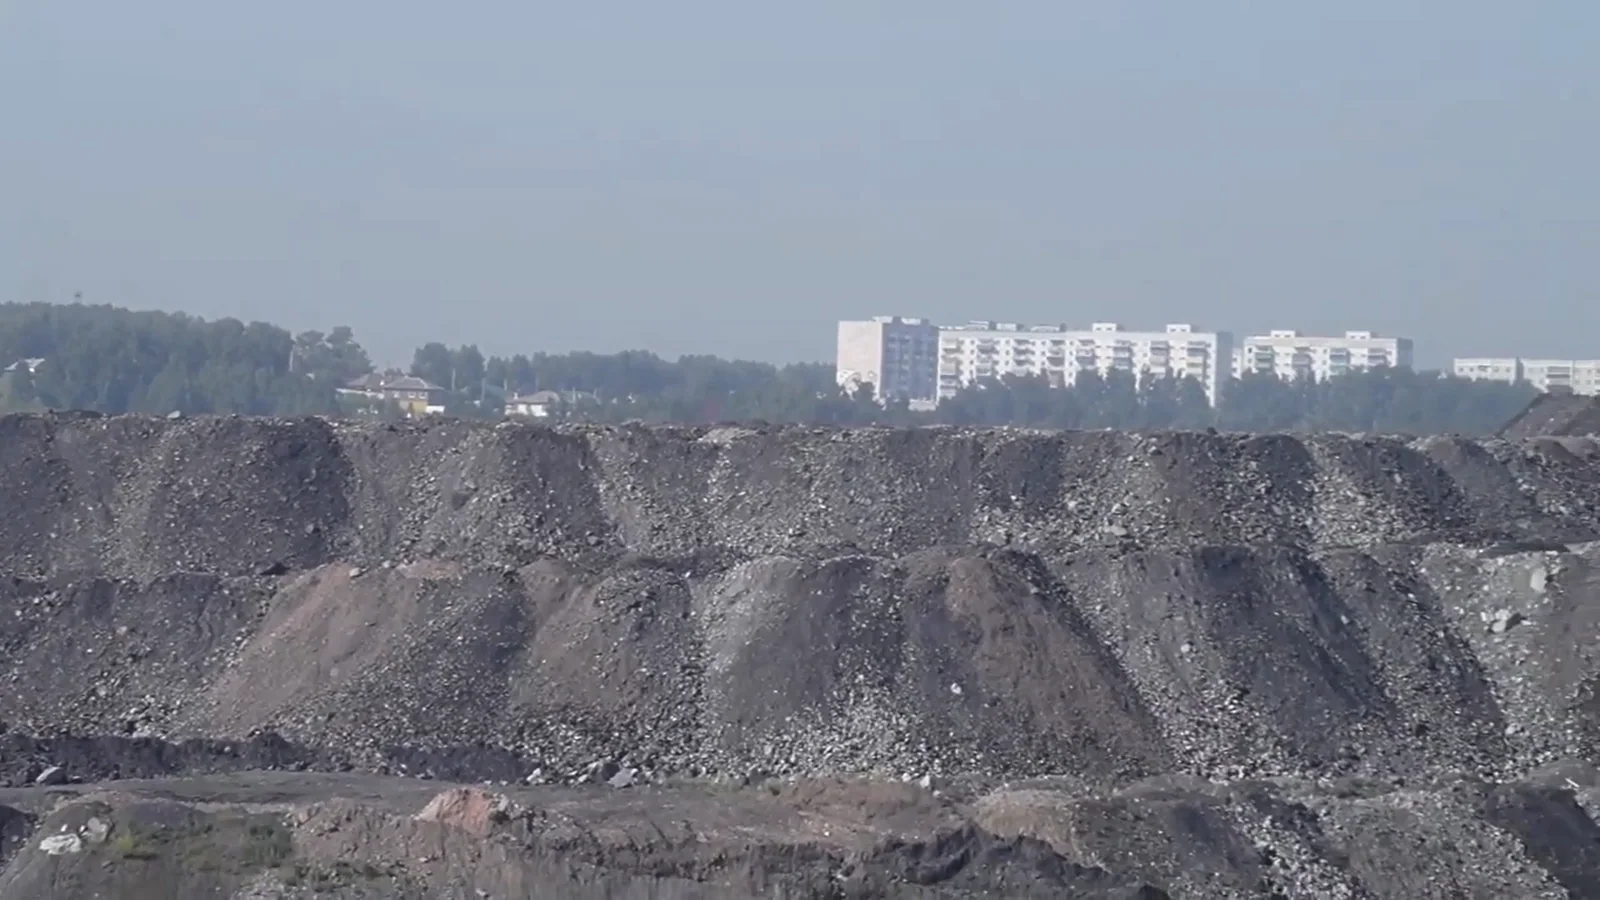
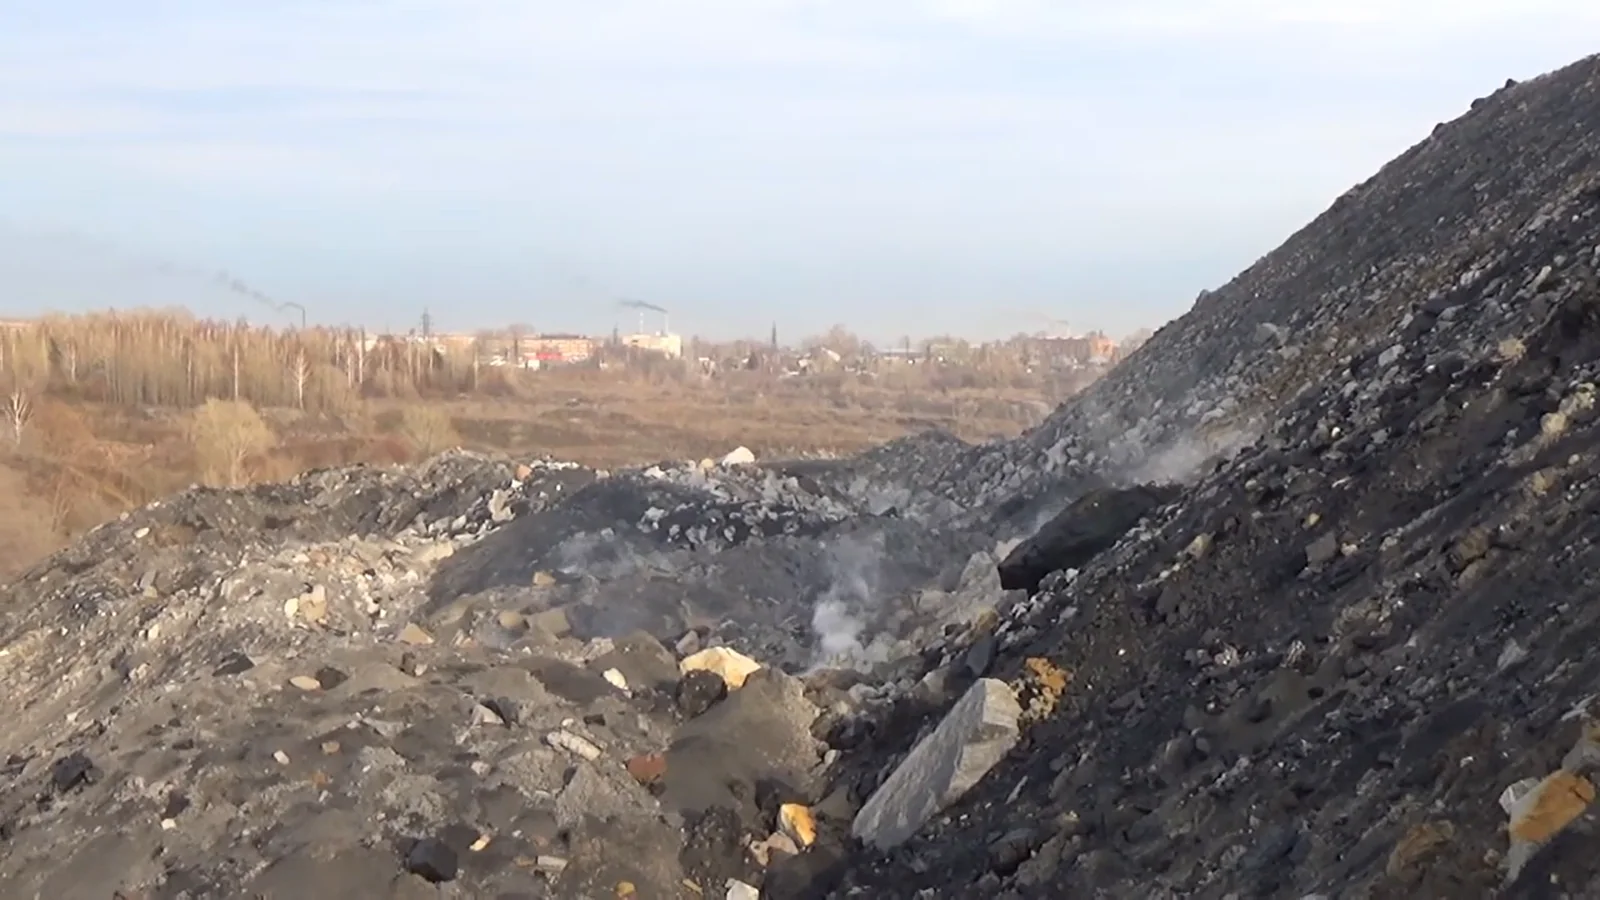
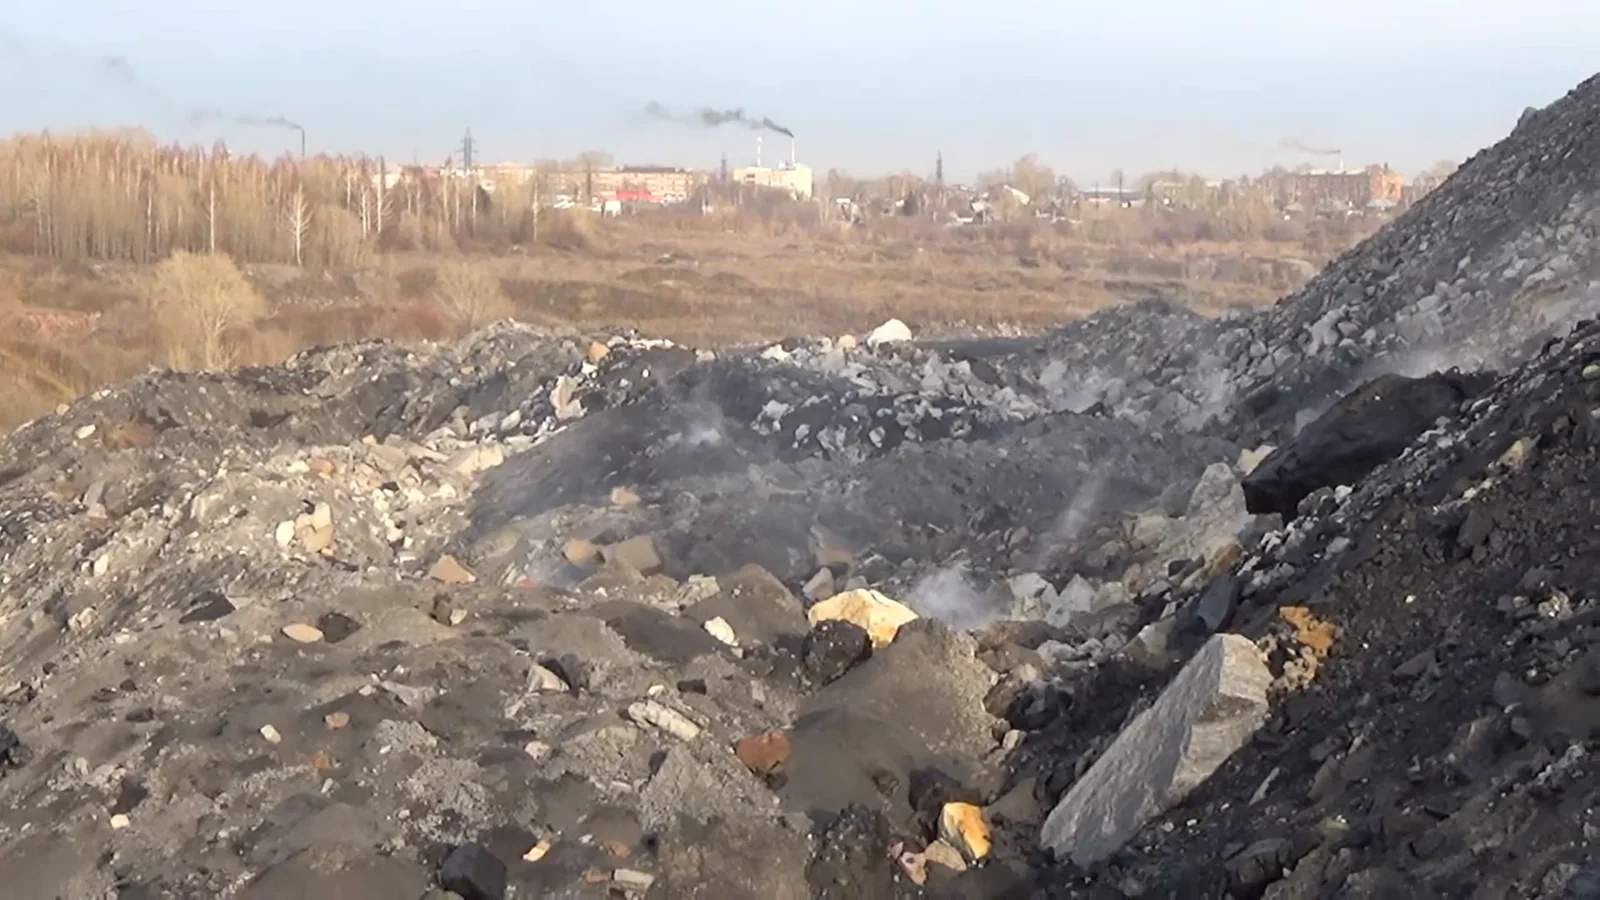
When coal waste self-heats and burns, gaseous combustion products and newly formed aerosol are added to the dust generated by mechanical disturbance. In material from burning coal waste piles in Portugal, researchers found carbon nanoparticles, their agglomerates, and mineral particles at the nanometre scale.6
Laboratory studies of spontaneous combustion show that the quantity and composition of soot and condensable particles change with temperature and the stage of combustion.7
Finding nanoparticles in burning material is only the first step. To assess exposure among residents, researchers need to measure how many particles entered the air, how they were diluted and dispersed with the wind, how they changed in the atmosphere, how they entered homes, and how long a person remained in the affected area. For burning coal waste heaps, I could not find a sufficient body of measurements covering this exposure pathway.
Coking
Coke ovens emit a mixture of particles, PAHs, benzene and other substances. In one workplace area, particles up to 1 micrometre accounted for 96.85% of the total particle number and 67.01% of the total surface area.8
But PM1 is not the same as UFP. This study confirms that a very fine fraction dominated by number at one particular site; it does not establish the exact share of particles below 100 nanometres.
The International Agency for Research on Cancer (IARC) classifies occupational exposure in coke production as carcinogenic to humans.9 This classification concerns the complex occupational mixture, not UFP as a separate particle-size class.
Coal-fired power station
The mineral matter in coal is heated in the boiler. Some less volatile minerals remain in larger ash particles. More volatile substances evaporate and then, as they cool, form new nuclei or condense on the surfaces of existing particles. Soot forms at the same time, while sulphur compounds can generate sulphate and sulphuric-acid aerosols.
The emissions therefore contain several particle groups of different sizes. This is why the size distribution of coal ash is described as bimodal or multimodal.
At three coal-fired power stations studied after flue-gas treatment, nanoparticles dominated the number of particles that remained, although they contributed little to the total mass. Sulphuric-acid aerosols played an important role at those installations.10
The treatment systems were nevertheless effective. In a study of Chinese power stations, the reported overall collection efficiencies were 96.38–99.89% for electrostatic precipitators and 99.94% for a fabric filter. Both systems had their lowest size-specific efficiency for particles between 0.1 and 1 micrometre, yet the fabric filter still captured 99.54% in that range.11 Most of this range is already above the UFP threshold. Overall mass-removal efficiency alone is not enough to show how many nanoparticles remained in the emissions or what sizes they were.1011
Domestic stove
With domestic stoves, the chimney is low and dilution is limited, while incomplete combustion can create soot, tarry organic matter and large numbers of fine particles.
In a preliminary field study of a rural home in China, a counter measured particles between 10 and 420 nanometres. When coal was used, the median total concentration was 164,300 particles per cubic centimetre. Particles between 31.6 and 100 nanometres were the most numerous.12 The figure of 164,300 refers to the entire measured range, not only to UFP.
This is a revealing example of what a person may breathe in a home heated with coal. The study covered one home; a broader picture would require comparable measurements for other stoves, types of coal and firing practices.
 Enlarge ↗
Coal’s chemical fingerprint
Size is only half the story. The other half is composition.
When coal is burned, arsenic, selenium, antimony, cadmium, mercury and other volatile or semi-volatile elements may vaporise and later condense onto or react with the surfaces of fine ash. Their concentrations can therefore be higher in particles smaller than one micrometre than in larger particles.13
The word “can” matters here. The result depends on the deposit, the chemical form of the element in the coal, temperature, calcium, iron and sulphur content, and the type of boiler and emission controls.
One study found particularly high levels of particle-bound mercury in the fraction below 20 nanometres.14 Results may differ between power stations, which makes measurements at each particular facility especially important.
The mineral portion of coal ash often contains aluminosilicate spheres, iron-bearing particles and magnetite particles. The organic portion may include soot and PAHs such as benzo[a]pyrene, phenanthrene, fluoranthene and pyrene.
Picene is sometimes used as one marker of coal smoke. To identify a source with greater confidence, researchers compare it with other PAHs, organic markers, elements, wind direction and the emission profile of local facilities.15
The same applies to arsenic and selenium: they are important analytical indicators, but they do not occur only in coal. A source is identified from a combination of several lines of evidence.
How researchers identify coal’s contribution
There are several approaches:
- PMF extracts statistical source factors from the measured data themselves, while CMB estimates source contributions using predefined chemical source profiles;
- electron microscopy examines the shape and composition of individual particles;
- PAH ratios and sets of organic markers help distinguish types of combustion;
- radiocarbon analysis separates fossil from modern carbon;
- wind, timing and spatial gradients link an aerosol to an operating source.
Each method answers only part of the question. Radiocarbon can distinguish fossil fuels from wood, but separating coal, oil and gas requires additional evidence. A statistical model depends on its input profiles, and marker ratios change as aerosol ages in the atmosphere.
Coal’s chemical fingerprint is not a single substance. It is a set of converging indicators.
 Enlarge ↗
Coal, oil, gas and diesel: the traces they leave
| Source | Common set of indicators | What to bear in mind |
|---|---|---|
| Coal combustion | aluminosilicate ash and iron-rich spheres; As/Se/Sb/Cd in fine ash; sulphates; a coal-related PAH profile, sometimes including picene | composition depends strongly on the coal and the technology |
| Fuel oil and other heavy petroleum fuels | V, Ni, sulphates, soot | V/Ni also occur in other sources; a complete profile is needed |
| Oil refining and flaring | sulphur-containing particles, soot, organic matter; peaks linked to operating conditions | composition depends on the feedstock and process |
| Natural gas | little mineral ash; NOx and secondary formation; particles from oils or impurities | a low mass of primary particles does not mean that no particles are emitted or that none form later in the atmosphere |
| Diesel | elemental carbon, organic matter, metals and oil additives; hopanes and steranes | these markers are not absolutely unique |
In a pilot-scale furnace, the peaks in particle number distribution differed by fuel: around 40–50 nanometres for coal, 70–100 for fuel oil and 15–25 for gas. But the spectrum changed substantially with dilution, temperature and aerosol ageing.16
At the large installations studied, gas turbines emitted relatively few particles directly from the stack. More nanoparticles remained after the coal-fired units and a refinery fluid catalytic cracking unit. The instruments did not, however, capture particles that might form later in the atmosphere from emitted gases.10
Each fuel leaves a different trace. Gas produces almost no mineral ash, but it generates nitrogen oxides and can contribute to secondary particle formation. Coal adds mineral and elemental material, soot and sulphur. Diesel is especially important where fuel is burned close to people — in a mine, an open pit or a city.
 Enlarge ↗
What happens after inhalation
The settling of particles in the respiratory tract is called deposition. Some UFP deposit in the nose and upper airways. Some reach the bronchi and alveoli. The proportion depends on particle size, shape and electrical charge, as well as breathing pattern, exertion and lung disease.
In a controlled study, people with asthma had greater deposition of ultrafine carbon particles than had previously been measured in healthy participants, and deposition increased during exercise. It was particularly high for the smallest particles.17
After deposition, harm may occur through several pathways:
- a particle irritates lung cells;
- the particle surface generates reactive oxygen species;
- local inflammation begins;
- signalling molecules produced during inflammation affect the blood, blood vessels and nervous system;
- soluble components pass into biological fluids;
- a small proportion of some nanoparticles may cross the alveolar barrier.
In an experiment using gold nanoparticles, researchers detected the particles in people’s blood after inhalation. Translocation into the blood was greater for 5-nanometre particles than for 30-nanometre particles.18 The study confirmed that this pathway is possible. It does not establish the same rate of translocation for coal-ash particles, urban aerosol or all UFP; those need to be studied separately.
The “Trojan horse”
This metaphor is used when a particle carries substances on its surface that would otherwise behave differently: PAHs, metals, sulphates and organic matter.
It is a figure of speech. Some compounds are on the particle surface, while others are embedded within it; some dissolve quickly, while others are barely bioavailable. The chemical form and dose therefore matter as much as the list of substances detected.
 Enlarge ↗
Health effects by organ system
Heart and blood vessels
A systematic review of 85 UFP studies found the most consistent short-term associations with systemic inflammation, changes in heart-rate variability and blood pressure.19
This is consistent with possible mechanisms of harm: oxidative stress, impaired function of the lining of blood vessels, disruption of the nervous regulation of the heart, and platelet activation.
Researchers most often observe short-term changes in cardiovascular function. Direct evidence linking UFP with heart attacks and strokes is less developed. The evidence is much stronger for PM2.5 and air pollution as a whole.
Lungs
The lungs receive the first and most direct dose. Studies associate UFP with inflammation and changes in respiratory function. In 2025, an analysis of 15,903 paediatric hospital admissions in Copenhagen found a short-term association between increased UFP concentrations and hospital admission for asthma.20
Studies of children have produced mixed results. In Toronto and in a smaller US study, UFP exposure during pregnancy was associated with later asthma in the child. In the Dutch PIAMA study, the association was no longer statistically significant after adjustment for NO₂ and black carbon in PM2.5.212223
For COPD, chronic bronchitis and lung cancer, the danger of the full mixture has been studied more extensively: PM2.5, diesel exhaust, coal and silica dust, household coal smoke and coke-oven emissions. The separate contribution of UFP to that risk remains to be determined.
Brain and nervous system
Animal studies have shown that some nanoparticles can reach the brain along the olfactory nerve.24 Quantifying this pathway in humans is much more difficult.
Studies of dementia have so far produced different answers. A study using Medicare data modelled UFP exposure by ZIP code for 2017 and followed new diagnoses from 2018 to 2020. The authors found a small positive association.25 The ACT study found no increased risk after adjustment for other pollutants.26
Researchers continue to investigate the possible association. Answering the question will require long-term observation with direct air measurements, not only modelled estimates.
Pregnancy and children
Black-carbon particles have been detected on the fetal side of human placentas.27 A systematic review of experimental evidence indicates that some ultrafine and engineered nanoparticles can cross the placental barrier, but human studies are few and their detection methods differ.28
The association of PM2.5 with preterm birth and low birth weight is much better studied than the association of these outcomes with UFP.29 PM2.5 evidence helps identify a possible risk, but it does not replace research specifically on ultrafine particles.
Metabolism
Evidence relating PM2.5 to type 2 diabetes and impaired glucose metabolism is growing. Less is known about UFP. In a controlled experiment involving people with diabetes, inhalation of ultrafine carbon briefly activated platelets and may have altered the function of the inner lining of blood vessels. The study did not investigate the development of diabetes itself.30
The effects of UFP on metabolism, diabetes and obesity remain active research questions.
 Enlarge ↗
Health: what is known about individual substances
PAHs and benzo[a]pyrene
Some PAHs damage DNA after metabolic activation. IARC classifies benzo[a]pyrene as carcinogenic to humans. But real coal smoke contains not one substance, but a mixture of PAHs, gases and particles.9
Arsenic
Inorganic arsenic compounds are carcinogenic to humans and can damage blood vessels and other organs.9 During coal combustion, arsenic can become enriched in fine ash.13 Assessing risk requires its chemical form and dose, not merely the presence of the element.
Selenium and fluorine
Selenium is essential in small amounts and toxic in excess.44 Fluorine likewise becomes harmful under prolonged high exposure.32
In Guizhou, coal and fluorine-containing clay contaminated food that was dried over household fires. In cases of chronic arsenic poisoning, most of the estimated dose also came through food rather than the air alone.3132
These cases demonstrate the danger of coal-related pollution, but they do not allow the illness to be explained by particle size alone.
Mercury and lead
Mercury and lead are toxic to the nervous system, especially while it is developing.4546 For mercury, environmental transformations and entry into food chains matter alongside particles near the stack. During coal combustion, the balance between gaseous and particle-bound forms depends on the technology and emission-control conditions.1314
Silica and coal dust
Pneumoconiosis, progressive massive fibrosis and loss of lung function among miners are established occupational health problems. The main hazard here is respirable coal and silica dust: particles small enough to penetrate deep into the lungs.33
Diesel nanoparticles are a separate hazard in mines. A study of more than 12,000 non-coal miners linked diesel exhaust with an increased risk of death from lung cancer.34 This is strong evidence of harm from diesel exhaust to workers, although the study did not examine coal-derived UFP separately.
Radionuclides
Combustion concentrates naturally occurring radionuclides in ash. For a 1 GW coal-fired power station operating for one year, UNSCEAR estimated that a typical person living nearby might receive 0.03–0.4 microsieverts per year from atmospheric discharges.35 Ash disposal sites, other types of power station and other exposure pathways require separate calculations.
Radionuclides should not be concealed, but there is no scientific basis for presenting them as the principal hazard of coal-derived UFP.
 Enlarge ↗
Three different coal stories
Xuanwei: documented harm from coal smoke
For decades, unusually high rates of lung cancer were recorded among never-smoking women in Xuanwei, Yunnan Province, in association with the household burning of “smoky” coal.
IARC has classified emissions from household coal combustion as carcinogenic to humans.36 A later study of the chemical constituents linked the risk with a group of PAHs and NO₂.37
This history confirms the danger of a particular coal-smoke mixture. This case does not establish what proportion of the risk was attributable to UFP, larger particles or gases.
Guizhou: inhalation was not the only pathway
In areas with endemic fluorosis and chronic arsenic poisoning, household coal polluted more than the air. Maize and chillies were dried above the stoves. In one assessment of arsenic exposure, food accounted for 50–80% of the dose, air for 10–20%, and water for 1–5%.31
The central point is that harmful substances reached people through several pathways, and most of the dose could come through food.
Kuzbass: nanoparticles were found — now the air must be measured
Studies of dust accumulated in Kuzbass snow identified a fraction below 0.1 micrometres near open-pit mines and the Belovo power station and investigated its toxicity to cells.45
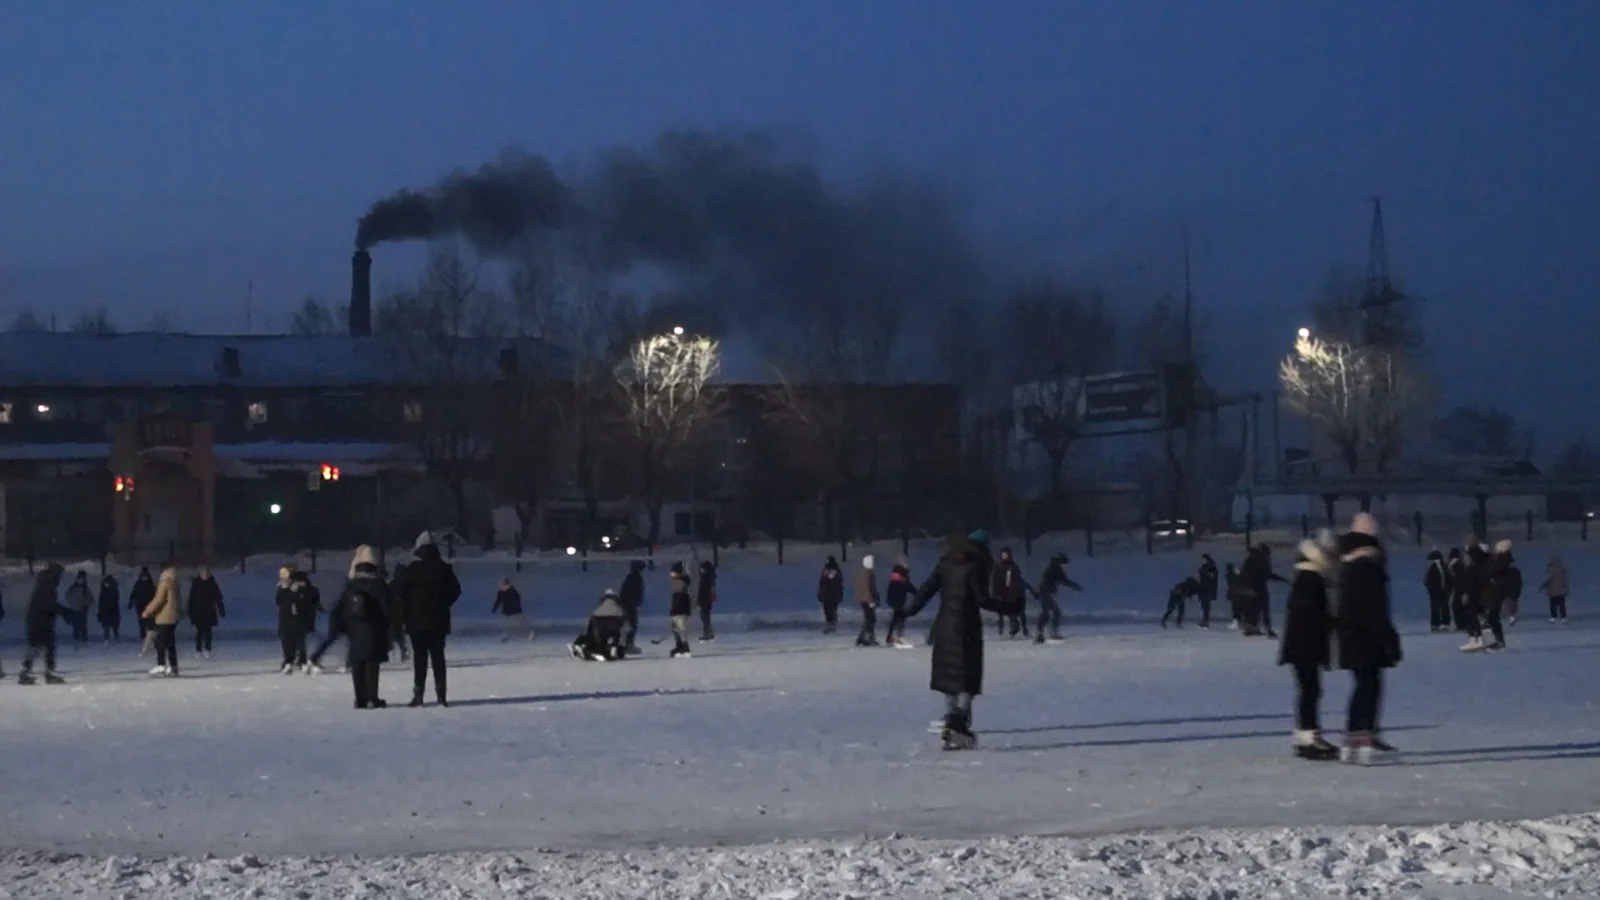
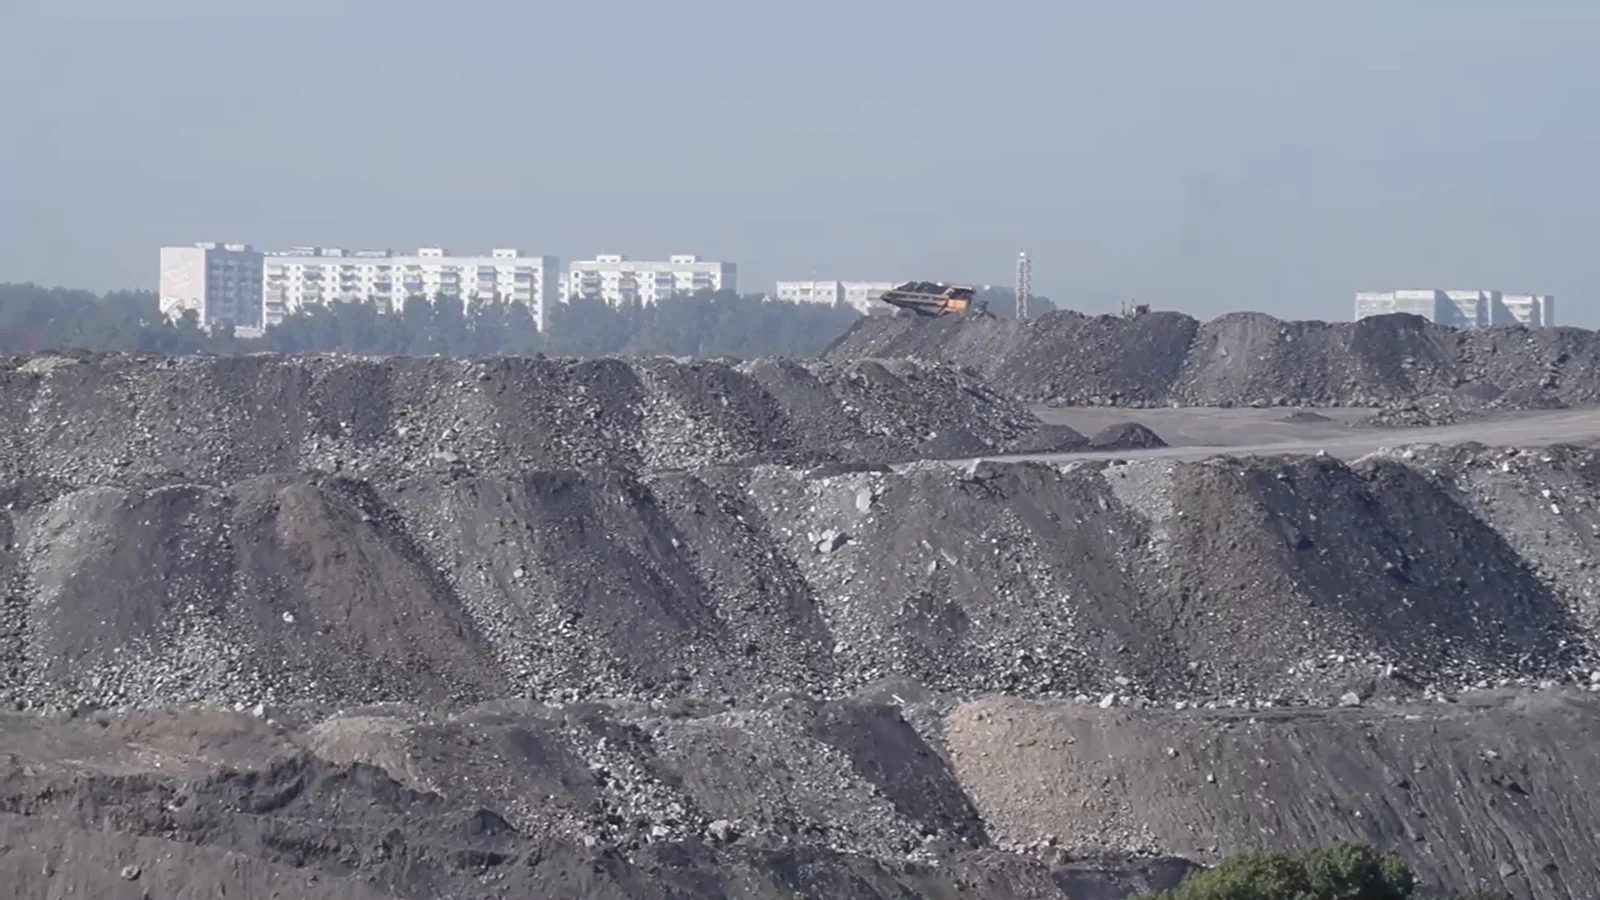
This is direct local evidence that particles of this size are present in Kuzbass’s industrial landscape. We do not yet have a comparable long-term PNC monitoring network that would allow us to determine how many such particles residents inhaled, how concentrations changed hour by hour, and what share came from each source.
The absence of an answer is not evidence of safety. But missing measurements cannot be replaced by a confident assertion.
 Enlarge ↗
Who is especially vulnerable
Risk depends on more than concentration. Age, health, time spent near the source, physical exertion and conditions in the home all matter.
Exposure means contact between a pollutant and a person, taking into account its concentration, route of entry and duration. Particular care is needed in relation to the exposure of:
- children, whose lungs and nervous systems are still developing;
- pregnant people;
- older people;
- people with asthma, COPD, cardiovascular disease or diabetes;
- miners, heavy-equipment operators, coke-oven workers and power-station workers;
- residents of homes heated with coal;
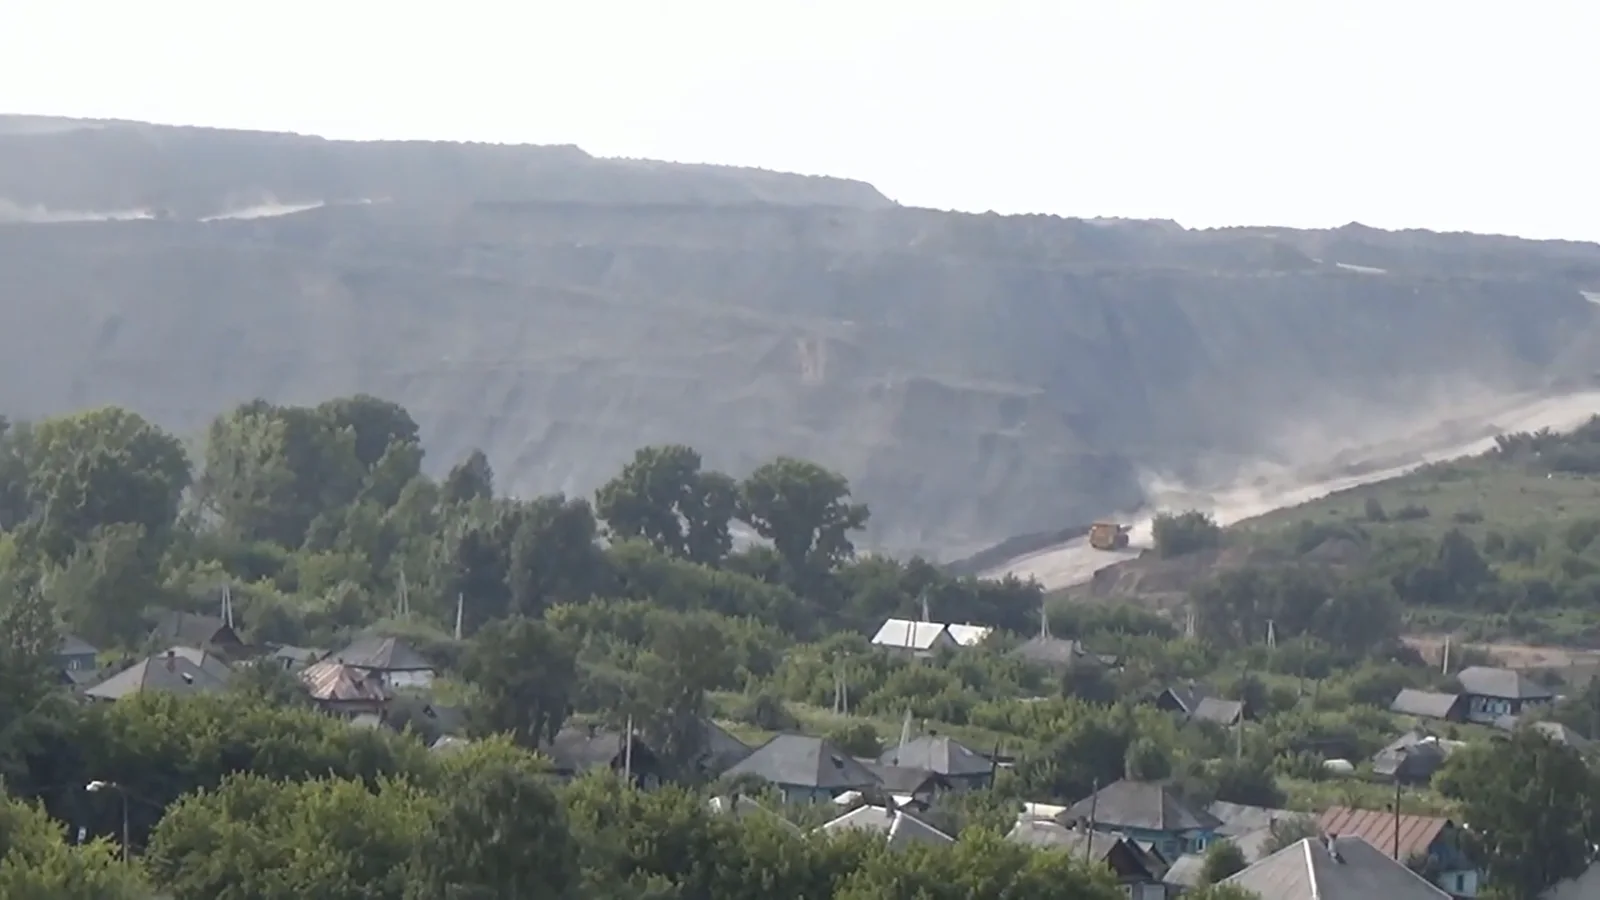
- people living near open-pit mines, industrial roads, power stations, coking plants and burning waste dumps.
Workers and residents are not the same population. A worker may receive a higher dose during a shift while being exposed simultaneously to coal dust, silica dust, diesel exhaust and gases. Concentrations for a resident are usually lower, but exposure continues for years and includes children and older people.
 Enlarge ↗
What science knows today
Supported by reasonably strong evidence
- combustion processes produce large numbers of particles at the nanoscale;
- coal combustion generates ultrafine ash, soot and secondary particles;
- toxic elements become enriched in the submicron ash of some coals;
- UFP deposit deep in the respiratory tract, and a proportion of some nanoparticles may enter the blood;
- short-term inflammatory and cardiovascular changes are among the effects most consistently associated with UFP;
- household coal smoke, coke production, diesel exhaust and outdoor air pollution are carcinogenic as specific exposures or mixtures.
Plausible, but findings are not consistent across studies
- the independent contribution of UFP to asthma and cardiovascular risk;
- the effect of long-term UFP exposure on mortality;
- whether some effects of urban and traffic-related UFP can be extrapolated to industrial sources;
- whether some coal-related nanofractions are more toxic than larger particles from the same sample.
Not yet established
- an estimate of what proportion of illness among residents of coal regions is attributable specifically to UFP;
- a universal “coal” concentration or a single chemical signature — composition depends on the coal and the technology;
- a scientifically established safe threshold for particle number concentration;
- a method for reconstructing UFP numbers from PM2.5 mass alone;
- that a single marker, without other evidence, establishes coal’s contribution;
- direct measurements linking the nanofraction found in snow with the dose people inhale;
- studies that separate the effects of coal-related UFP on dementia, diabetes and lung cancer from the effects of the full pollutant mixture.
Why official statistics barely see them
The main reason is simple: official systems primarily measure pollutants for which widely accepted methods and standards already exist.
PM2.5 and PM10 are expressed in micrograms per cubic metre. UFP are expressed as particles per cubic centimetre and as a size spectrum. This requires different instruments, rapid recording and strict calibration.
Russia’s SanPiN 1.2.3685-21 contains mass-based standards for PM2.5 and PM10. I found no separate entry for UFP number concentration in its table of air-quality standards. I checked the version dated 24 December 2025, with amendments in force from 1 March 2026; the access date was 12 October 2026.38
In the United States, the federal National Ambient Air Quality Standards likewise cover PM2.5 and PM10, not ultrafine particle number.39
EU Directive 2024/2881 requires UFP monitoring at major background stations and at locations where high concentrations are expected. It does not, however, set a limit value for UFP. EU Member States must transpose these provisions into national law by 11 December 2026.40 This is the deadline for transposition into national law; it should not be read as evidence that a fully operational monitoring network already exists in every country at the time of publication.
The absence of a standard does not make the particles safe. The WHO attributes the lack of a numerical recommendation to insufficient evidence, not to an absence of harm. Its good-practice reference values can guide monitoring, but they are not statutory limits or thresholds of safety.1
This gap creates a vicious circle. Without measurements, health research is difficult. With little research, setting a standard is difficult. Without a standard, monitoring remains rare.
What can be done
By industry and cities
- measure not only PM2.5 and PM10 mass, but also PNC with a stated particle-size range;
- place instruments near residential areas, industrial roads, power stations, coke ovens and burning waste dumps;
- measure NO₂, SO₂, black carbon, elements and meteorological conditions at the same time;
- publish raw hourly data, not only annual averages;
- control diesel machinery and replace it with cleaner equipment where possible;
- prevent waste-dump self-heating and rapidly contain fires;
- assess emission controls not only by total dust mass, but also by particle-size spectrum;
- reduce sulphur-containing and other gaseous emissions that form secondary particles in the air.
At home
A HEPA filter can capture particles smaller than 100 nanometres. It does not work like a sieve: Brownian diffusion is particularly important for the smallest particles, while interception and inertial impaction help capture particles of other sizes.43 The performance of the complete air cleaner depends on how well it is sealed, the airflow rate and whether its clean air delivery rate (CADR) is appropriate for the room size.41
Practical steps include:
- choose an air cleaner with a genuine HEPA filter and an adequate CADR;
- do not use ozone generators or devices designed to produce ozone;
- keep windows closed during visible smoke, a fire or a nearby industrial pollution event;
- ventilate when the wind is not blowing from the source and outdoor pollution is lower;
- replace filters regularly;
- remove indoor sources, especially household coal burning, tobacco smoke and faulty stoves.
A filter does not remove every gas and cannot replace emission reductions. Studies of domestic air cleaners provide good evidence that they reduce indoor PM2.5. Much less is known about how far this prevents particular diseases attributable specifically to UFP.
Invisible does not mean imaginary
After that hearing, I was left with a question: what is really in the dust that residents of coal towns are told to endure?
There was no simple answer, because “coal dust” is not a single substance. Conventional mass measurements are not enough. We may know how much the pollution weighs without knowing how many particles were in the air, how large they were or what was on their surfaces.
Coal travels a long path: seam, blast, crusher, coal preparation plant, rail wagon, household stove, coke plant or power-station boiler. The aerosol is different at every stage. It cannot all be called a single type of dust, and its effects cannot be explained by one substance.
These are still different bodies of evidence. Studies of PM2.5, diesel exhaust, arsenic, household smoke and laboratory nanoparticles reveal separate parts of the picture, but they do not replace direct research on coal-related UFP.
The honest conclusion is already serious enough.
Across the coal chain, mining, processing and combustion can generate large numbers of particles that we cannot see. The PM2.5 mass indicator tells only part of their story. These particles may carry toxic and chemically active substances. Evidence exists for some mechanisms of harm and short-term health changes. But a comprehensive estimate of illness attributable specifically to coal-related UFP is not yet available.
The first step is not to invent a precise risk where it has not been measured. It is to begin measuring what has remained invisible: the number of particles, their size and composition, and their path from source to person.
Short glossary
- UFP — ultrafine particles, usually smaller than 100 nm.
- PNC — particle number concentration, usually particles/cm³.
- PM0.1 — a mass-based size fraction with an upper cut-off of approximately 0.1 µm. PM0.1 and UFP number concentration are different measures and are not necessarily directly comparable.
- PM1, PM2.5, PM10 — particles with the corresponding aerodynamic cut-off, usually expressed by mass.
- Nucleation — the formation of new particles from gas molecules.
- Coagulation — particles joining together, reducing their number while increasing their size.
- PMF — a model that extracts likely source factors from patterns in the measured data themselves.
- CMB — a model that estimates source contributions using predefined chemical source profiles.
- PAHs — polycyclic aromatic hydrocarbons.
Sources
Open the full list of 46 sources
- World Health Organization. 2021. WHO Global Air Quality Guidelines: Particulate Matter (PM2.5 and PM10), Ozone, Nitrogen Dioxide, Sulfur Dioxide and Carbon Monoxide. WHO. https://www.who.int/publications/i/item/9789240034228.
- Bugarski A.D. et al. 2021. Diesel Aerosols in an Underground Coal Mine. In: Proceedings of the 18th North American Mine Ventilation Symposium. DOI: 10.1201/9781003188476-10; NIOSH Stacks.
- Saarikoski S. et al. 2019. Sources and Characteristics of Particulate Matter at Five Locations in an Underground Mine. Aerosol and Air Quality Research, 19, 2613–2624. DOI: 10.4209/aaqr.2019.03.0118.
- Larionov A. et al. 2022. Chemical Composition and Toxicity of PM10 and PM0.1 Samples near Open-Pit Mines and Coal Power Stations. Life, 12(7), 1047. DOI: 10.3390/life12071047.
- Leshukov T. et al. 2022. Fractional Composition and Toxicity Coal-Rock of PM10–PM0.1 Dust near an Opencast Coal Mining Area and Coal-Fired Power Station. Sustainability, 14(24), 16594. DOI: 10.3390/su142416594.
- Ribeiro J. et al. 2010. Identification of Nanominerals and Nanoparticles in Burning Coal Waste Piles from Portugal. Science of the Total Environment, 408(23), 6032–6041. DOI: 10.1016/j.scitotenv.2010.08.046.
- Tan B. et al. 2026. Experimental Study on Emission Characteristics of Soot Particles during Spontaneous Combustion of Coal. Fuel, 403, 136139. DOI: 10.1016/j.fuel.2025.136139.
- Xie Q. et al. 2015. Size Distribution Characteristics of Particulate Matter in the Top Areas of Coke Oven. Chinese Journal of Industrial Hygiene and Occupational Diseases, 33(3), 161–165. PubMed 25916437.
- International Agency for Research on Cancer. No date. Agents Classified by the IARC Monographs. IARC Monographs. Accessed 12 October 2026. https://monographs.iarc.who.int/agents-classified-by-the-iarc/.
- Mertens J. et al. 2020. Fine and Ultrafine Particle Number and Size Measurements from Industrial Combustion Processes: Primary Emissions Field Data. Atmospheric Pollution Research, 11(4), 803–814. DOI: 10.1016/j.apr.2020.01.008.
- Yi H. et al. 2006. Characteristics of Inhalable Particulate Matter Concentration and Size Distribution from Power Plants in China. Journal of the Air & Waste Management Association, 56(9), 1243–1251. DOI: 10.1080/10473289.2006.10464590.
- Luo Z. et al. 2022. Impacts of Household Coal Combustion on Indoor Ultrafine Particles—A Preliminary Case Study and Implication on Exposure Reduction. International Journal of Environmental Research and Public Health, 19(9), 5161. DOI: 10.3390/ijerph19095161.
- Senior C., Granite E., Linak W., Seames W. 2020. Chemistry of Trace Inorganic Elements in Coal Combustion Systems: A Century of Discovery. Energy & Fuels, 34(12), 15141–15168. DOI: 10.1021/acs.energyfuels.0c02375.
- Peng Y. et al. 2021. Mercury Speciation and Size-Specific Distribution in Filterable and Condensable Particulate Matter from Coal Combustion. Science of the Total Environment, 787, 147597. DOI: 10.1016/j.scitotenv.2021.147597.
- Oros D.R., Simoneit B.R.T. 2000. Identification and Emission Rates of Molecular Tracers in Coal Smoke Particulate Matter. Fuel, 79(5), 515–536. DOI: 10.1016/S0016-2361(99)00153-200153-2).
- Chang M.-C.O. et al. 2004. Measurement of Ultrafine Particle Size Distributions from Coal-, Oil-, and Gas-Fired Stationary Combustion Sources. Journal of the Air & Waste Management Association, 54(12), 1494–1505. DOI: 10.1080/10473289.2004.10471010.
- Chalupa D.C. et al. 2004. Ultrafine Particle Deposition in Subjects with Asthma. Environmental Health Perspectives, 112(8), 879–882. DOI: 10.1289/ehp.6851.
- Miller M.R. et al. 2017. Inhaled Nanoparticles Accumulate at Sites of Vascular Disease. ACS Nano, 11(5), 4542–4552. DOI: 10.1021/acsnano.6b08551.
- Ohlwein S. et al. 2019. Health Effects of Ultrafine Particles: A Systematic Literature Review Update of Epidemiological Evidence. International Journal of Public Health, 64(4), 547–559. DOI: 10.1007/s00038-019-01202-7.
- Bergmann M. et al. 2025. Short-Term Exposure to Ultrafine Particles and Asthma Hospital Admissions in Children in Copenhagen, Denmark. Thorax, 80(11), 796–802. DOI: 10.1136/thorax-2024-222465.
- Lavigne E. et al. 2019. Spatiotemporal Variations in Ambient Ultrafine Particles and the Incidence of Childhood Asthma. American Journal of Respiratory and Critical Care Medicine, 199(12), 1487–1495. DOI: 10.1164/rccm.201810-1976OC.
- Wright R.J. et al. 2021. Prenatal Ambient Ultrafine Particle Exposure and Childhood Asthma in the Northeastern United States. American Journal of Respiratory and Critical Care Medicine, 204(7), 788–796. DOI: 10.1164/rccm.202010-3743OC.
- Yu Z. et al. 2022. Ambient Ultrafine Particles and Asthma Onset until Age 20: The PIAMA Birth Cohort. Environmental Research, 214(1), 113770. DOI: 10.1016/j.envres.2022.113770.
- Oberdörster G. et al. 2004. Translocation of Inhaled Ultrafine Particles to the Brain. Inhalation Toxicology, 16(6–7), 437–445. DOI: 10.1080/08958370490439597.
- Zhu Q. et al. 2025. Associations between Ultrafine Particles and Incident Dementia in Older Adults. Environmental Science & Technology, 59(11), 5443–5451. DOI: 10.1021/acs.est.4c10574.
- Blanco M.N. et al. 2024. Traffic-Related Air Pollution and Dementia Incidence in the Adult Changes in Thought Study. Environment International, 183, 108418. DOI: 10.1016/j.envint.2024.108418.
- Bové H. et al. 2019. Ambient Black Carbon Particles Reach the Fetal Side of Human Placenta. Nature Communications, 10, 3866. DOI: 10.1038/s41467-019-11654-3.
- Bongaerts E. et al. 2020. Translocation of (Ultra)fine Particles and Nanoparticles across the Placenta: A Systematic Review on the Evidence of In Vitro, Ex Vivo, and In Vivo Studies. Particle and Fibre Toxicology, 17, 56. DOI: 10.1186/s12989-020-00386-8.
- Yuan L. et al. 2019. Maternal Fine Particulate Matter (PM2.5) Exposure and Adverse Birth Outcomes: An Updated Systematic Review Based on Cohort Studies. Environmental Science and Pollution Research, 26(14), 13963–13983. DOI: 10.1007/s11356-019-04644-x.
- Stewart J.C. et al. 2010. Vascular Effects of Ultrafine Particles in Persons with Type 2 Diabetes. Environmental Health Perspectives, 118(12), 1692–1698. DOI: 10.1289/ehp.1002237.
- Liu J. et al. 2002. Chronic Arsenic Poisoning from Burning High-Arsenic-Containing Coal in Guizhou, China. Environmental Health Perspectives, 110(2), 119–122. DOI: 10.1289/ehp.02110119.
- Guo J. et al. 2021. Review on Health Impacts from Domestic Coal Burning: Emphasis on Endemic Fluorosis in Guizhou Province, Southwest China. Reviews of Environmental Contamination and Toxicology, 258, 1–25. DOI: 10.1007/398_2021_71.
- Almberg K.S., Cohen R.A. 2023. Modern Coal Miners Have Higher Death Rates from Lung Diseases Than Their Predecessors. NIOSH Science Bulletin. https://www.cdc.gov/niosh/bulletin/2023/mining-lung-disease.html.
- Attfield M.D. et al. 2012. The Diesel Exhaust in Miners Study: A Cohort Mortality Study with Emphasis on Lung Cancer. Journal of the National Cancer Institute, 104(11), 869–883. DOI: 10.1093/jnci/djs035.
- United Nations Scientific Committee on the Effects of Atomic Radiation. 2025. Sources, Effects and Risks of Ionizing Radiation: UNSCEAR 2024 Report, Volume II, Scientific Annex B. United Nations. https://www.unscear.org/unscear/uploads/documents/publications/UNSCEAR_2024_Annex-B.pdf.
- International Agency for Research on Cancer. 2010. Household Use of Solid Fuels and High-Temperature Frying. IARC Monographs, Volume 95. https://publications.iarc.who.int/113.
- Vermeulen R. et al. 2019. Constituents of Household Air Pollution and Risk of Lung Cancer among Never-Smoking Women in Xuanwei and Fuyuan, China. Environmental Health Perspectives, 127(9), 097001. DOI: 10.1289/EHP4913.
- Chief State Sanitary Physician of the Russian Federation. 2021. SanPiN 1.2.3685-21: Hygienic Standards and Requirements for Ensuring the Safety and/or Harmlessness of Environmental Factors for Humans, Chapter I, Table 1.1; version dated 24 December 2025, amendments effective from 1 March 2026. Accessed 12 October 2026. https://www.consultant.ru/document/cons_doc_LAW_375839/fa69e15a74de57cbe09d347462434c11fcfeeaca/.
- U.S. Environmental Protection Agency. No date. NAAQS Table. Accessed 12 October 2026. https://www.epa.gov/criteria-air-pollutants/naaqs-table.
- European Parliament and Council of the European Union. 2024. Directive (EU) 2024/2881 of 23 October 2024 on Ambient Air Quality and Cleaner Air for Europe (Recast). Official Journal of the European Union. https://eur-lex.europa.eu/legal-content/EN/TXT/?uri=CELEX%3A32024L2881.
- U.S. Environmental Protection Agency. 2024. Guide to Air Cleaners in the Home. EPA 402-F-24-002. https://www.epa.gov/indoor-air-quality-iaq/guide-air-cleaners-home.
- Chyka P.A., Seger D. 1997. Position Statement: Single-Dose Activated Charcoal. Journal of Toxicology: Clinical Toxicology, 35(7), 721–741. DOI: 10.3109/15563659709162569.
- Alonso M., Alguacil F.J. 2001. An Introduction to Aerosol Filtration. Revista de Metalurgia, 37(6), 693–712. DOI: 10.3989/revmetalm.2001.v37.i6.536.
- National Institutes of Health, Office of Dietary Supplements. No date. Selenium: Fact Sheet for Health Professionals. Accessed 12 October 2026. https://ods.od.nih.gov/factsheets/Selenium-HealthProfessional/.
- World Health Organization. No date. Lead Poisoning and Health. Accessed 12 October 2026. https://www.who.int/news-room/fact-sheets/detail/lead-poisoning-and-health.
- World Health Organization. No date. Mercury and Health. Accessed 12 October 2026. https://www.who.int/news-room/fact-sheets/detail/mercury-and-health.