I was taken away from Khakassia when I was very young. I returned when I was already over forty. It was my homeland, but I had to get to know it almost from scratch.
That was when I first truly saw the Koibal Steppe. Vivid, colourful, diverse — and astonishingly fragile. A steppe that seems so vast at first glance, yet where everything is connected: lakes, groundwater, grasses, birds, animals and people’s lives.
Then I saw the coal dragons. I saw lakes being drained, waste dumps smoking and burning, and the land around the open-pit mines changing. For me, this had become more than coal extraction. What I saw was the deliberate destruction of a unique landscape.
The consequences will remain here long after the coal companies have ceased operating. I think about the people who were born, grew up and still live in the Koibal Steppe. How many more years will they have to pay for this mining? What water will their children drink? What will remain when the machinery has gone?
As I began to look more closely, another question joined the coal dust, burning waste dumps and disappearing water: uranium. I learnt about uranium mineralisation in this area and about reports of uranium being found in water that people used for drinking.
Uranium’s presence underground and its entry into drinking water are different things. That is precisely why I wanted to understand where it had been found, at what concentrations, what had been known about it before, and how coal mining might change the conditions under which it enters the water.
This work begins with those questions. For me, they concern a very particular place: the homeland I came to see so late in life, and which I want to preserve.
Krasnopolye and the water people could no longer collect from the standpipes
In spring 2021, uranium ceased to be a matter of geology for the people of Krasnopolye. It became a question of where to get water.
On 2 April, journalist Irina Nichkova reported in Shans that standpipes had been sealed and the use of water supply facilities temporarily suspended by court order. The school, nursery, community centre, rural medical and midwifery post, and some residents depended on the centralised source. Others used their own boreholes. In the same article, Yevgeny Mamayev, head of the regional branch of the All-Russia People’s Front (ONF), asked why measures to provide safe water had not been taken after the previous year’s results.[1]
The concentrations were recorded in more than newspaper reports. Khakassia’s state report on the environment for 2021 states that uranium in the groundwater source supplying Krasnopolye’s centralised water system measured 0.055–0.066 milligrams per litre, against a regulatory limit of 0.015 mg/L cited in the document. That is approximately 3.7 to 4.4 times the limit. The report names three laboratories that carried out the analyses.[2, PDF p. 34]
A milligram per cubic decimetre, the unit used in the report, is the same concentration as a milligram per litre. These figures concern the mass of uranium in a drinking water source.
In a public explanation, a representative of Rospotrebnadzor, Russia’s sanitary regulator, said that exceeding the limit did not mean people would develop radiation sickness.[1] But residents’ question was broader: why had they been supplied with water exceeding a chemical limit, and how could an alternative be provided? An assurance that radiation sickness was not expected did not answer the question about drinking water quality.
More than one village appeared on the map
In 2020, sanitary and epidemiological service specialists E. A. Pivovarova, A. A. Pivovarov and V. E. Kurganov published uranium measurements for the centralised drinking water sources of nine settlements in Khakassia.[3]
If the table is wider than the screen, scroll horizontally to see every column.
| Settlement | Administrative area | Uranium, mg/L, as reported in the study’s table |
|---|---|---|
| Novotroitskoye | Beysky District | 0.080 ± 0.010 |
| Krasnopolye | Altaisky District | 0.061 ± 0.010 |
| Lukyanovka | Altaisky District | 0.042 ± 0.011 |
| Novorossiyskoye | Altaisky District | 0.040 ± 0.010 |
| Bograd | Bogradsky District | 0.032 ± 0.011 |
| Sorsk | City of Sorsk | 0.030 ± 0.010 |
| Moskovskoye | Ust-Abakansky District | 0.029 ± 0.007 |
| Vershino-Bidzha | Ust-Abakansky District | 0.017 ± 0.004 |
| Shira | Shirinsky District | 0.007 ± 0.002 |
Source: Table 4, printed p. 49 / PDF p. 4.[3] The values and uncertainties are reproduced from that table. The article does not give the sampling dates for these particular samples; 2020 is the publication year. The authors used 0.015 mg/L as the regulatory limit for comparison.
The authors identified seven settlements as exceeding the limit: Novotroitskoye, Krasnopolye, Lukyanovka, Novorossiyskoye, Bograd, Sorsk and Moskovskoye. Allowing for the reported uncertainty interval, the result for Vershino-Bidzha is close to the limit; the authors did not include it in that list. Shira’s value is below the limit. There is also an editorial discrepancy within the original paper: the text gives the highest concentration as 0.061 mg/L, whereas the table lists 0.080 for Novotroitskoye. Our table retains the original entry rather than guessing a correction to someone else’s result.[3]
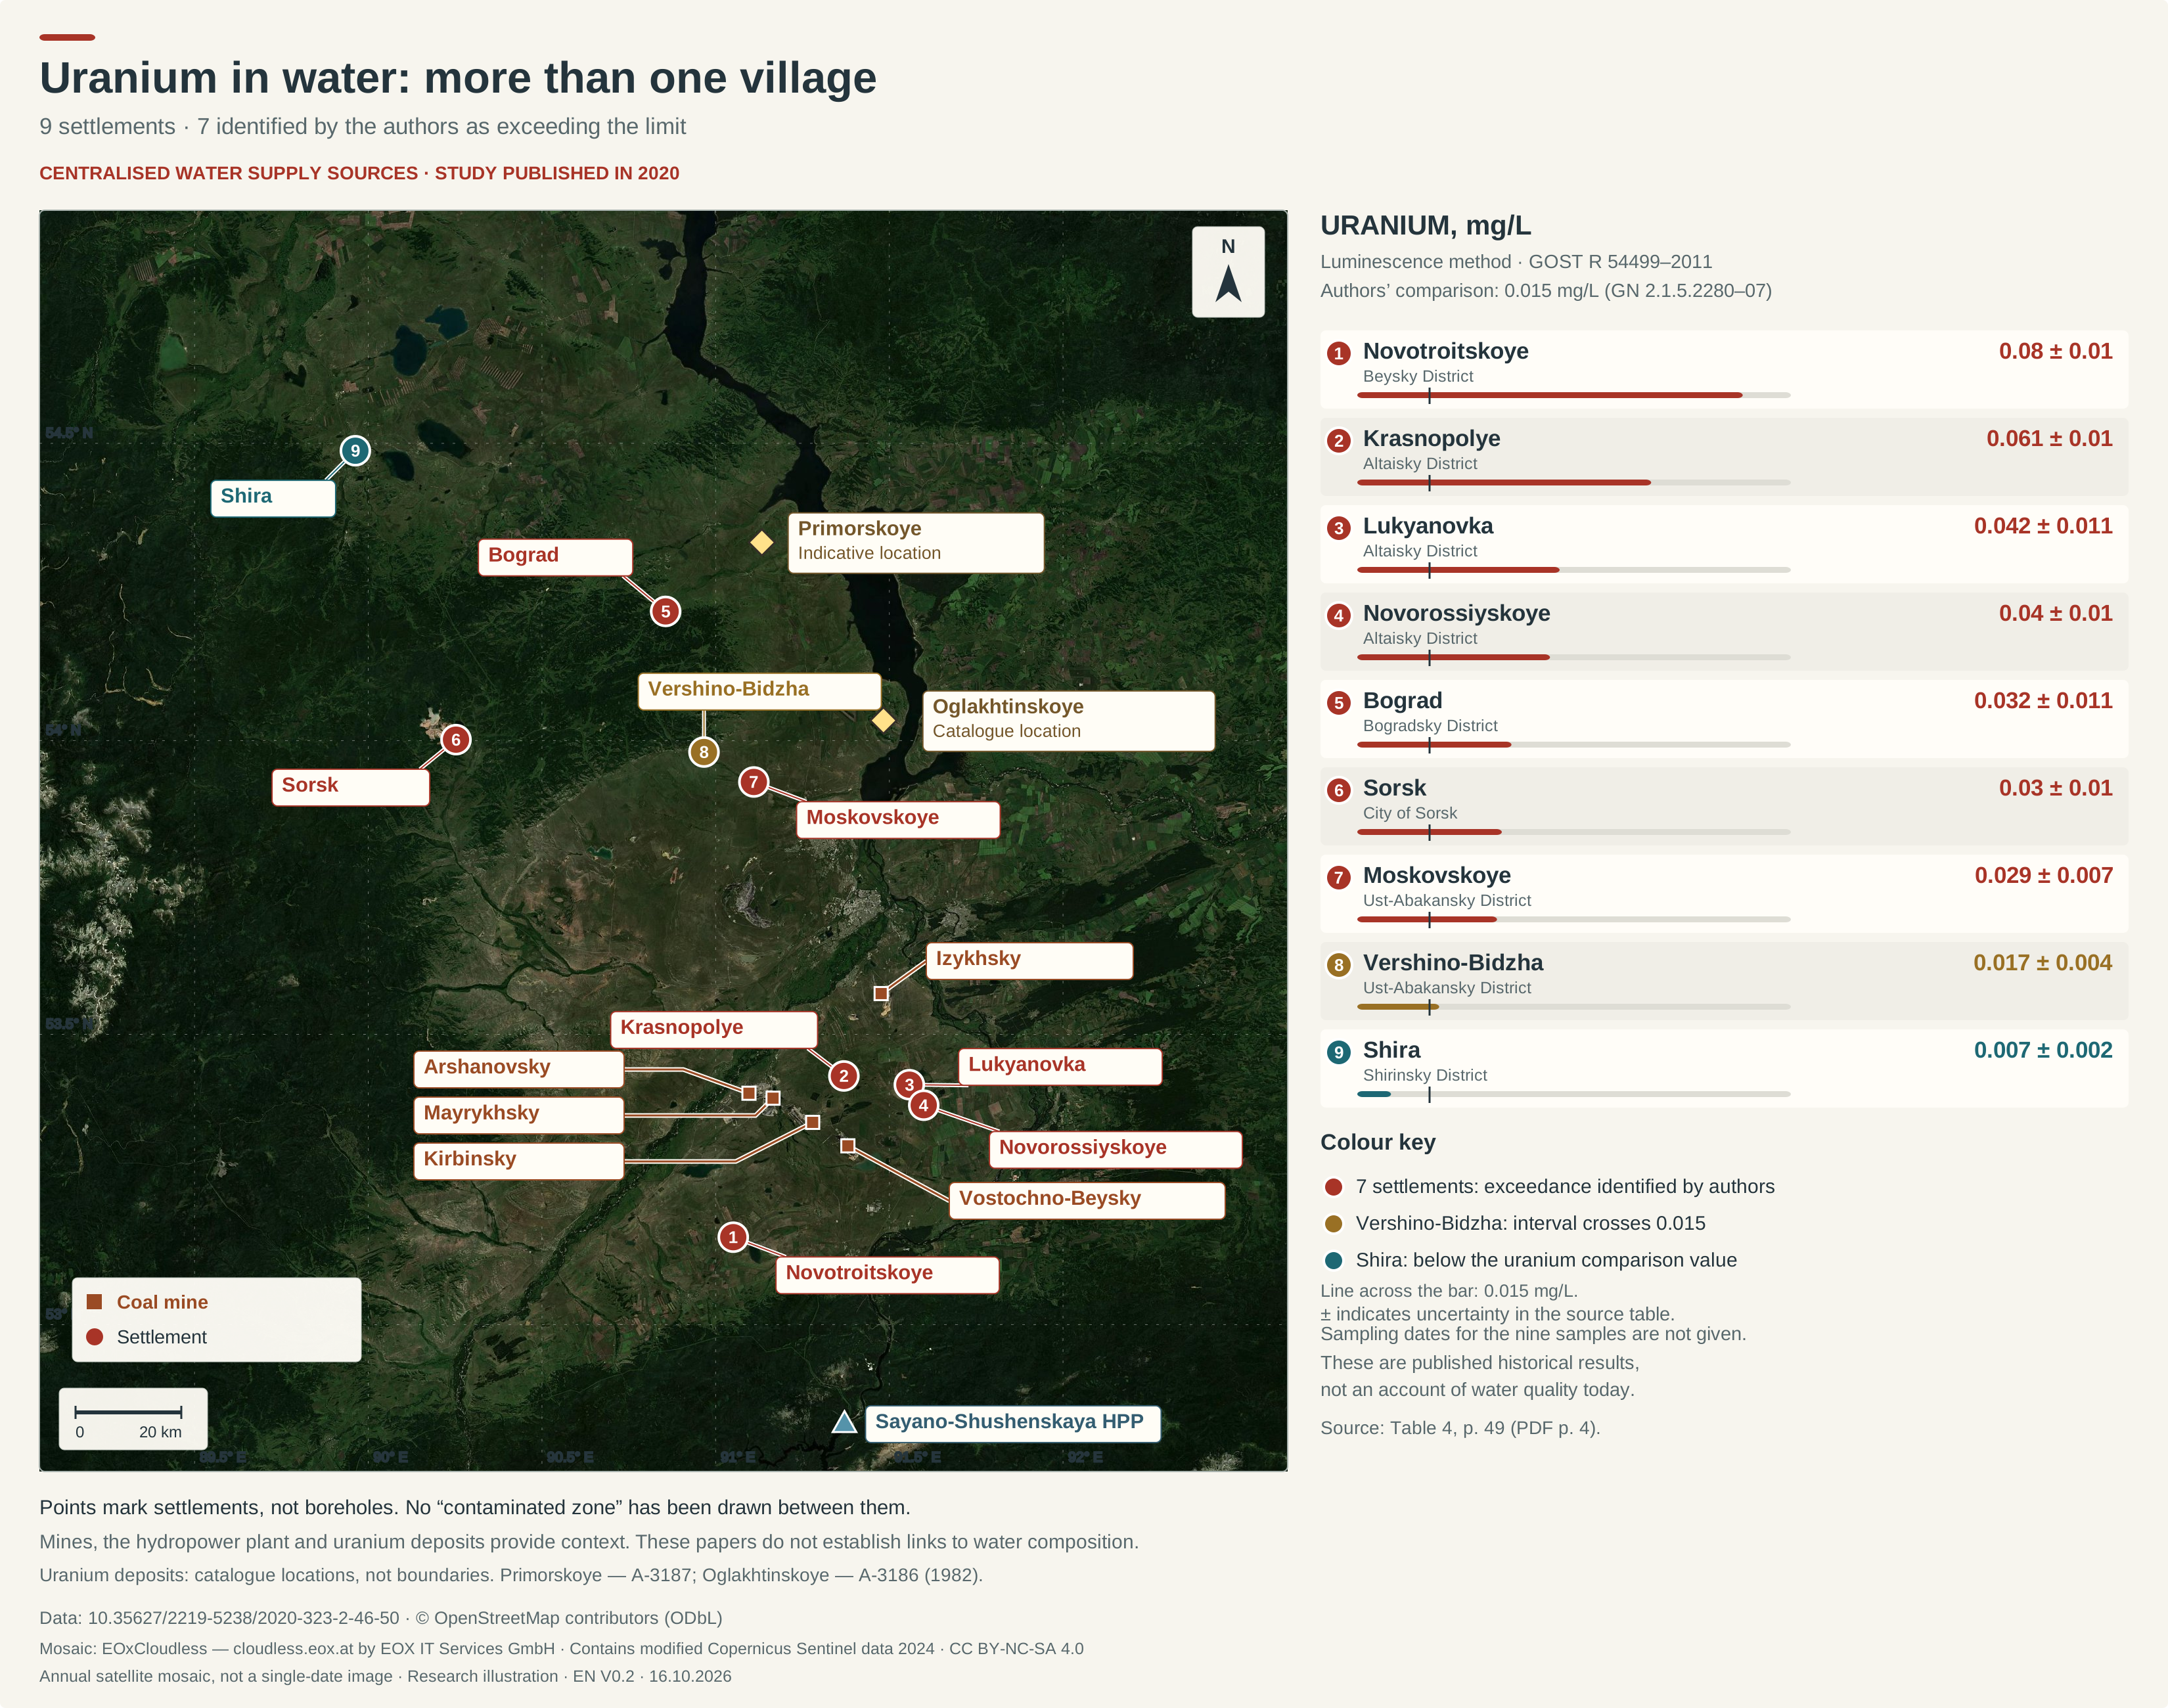
The nine settlements in the 2020 study. The colours reflect the results and the authors’ conclusions. Open-pit mines and uranium sites are shown as geographical reference points. The basemap is the 2024 EOxCloudless satellite mosaic; attribution and licensing details are given in the illustrations section.
This history began before the public water crisis in Krasnopolye. A 2016 paper describes regional monitoring of gross activity in water since 1997 and of individual natural radionuclides since 2002. Krasnopolye was already among the settlements with high gross alpha activity. It also appears in monitoring findings published in 2013.[4][5]
The 2020 study gives a further indication of the scale: during 2005–2018, 54.9 ± 10.3% of samples exceeded the gross alpha activity control level, and water with such results came from 124 sources.[3] These are radioactivity screening results, not the proportion of all water sources exceeding a chemical limit for uranium. Even so, the figures show that the sanitary service was dealing with a persistent regional problem, not a single unexpected sample.
Why an answer about background radiation does not settle the water question
Uranium is both a radioactive element and a chemically toxic substance. The World Health Organization assesses uranium in drinking water primarily in terms of its chemical toxicity to the kidneys. Its provisional guideline value of 0.03 mg/L concerns chemical toxicity, not radiological effects. It does not replace the Russian limit of 0.015 mg/L used for comparison in the documents cited here.[7]
Water quality tables use three different kinds of measurement.
If the table is wider than the screen, scroll horizontally to see every column.
| Indicator | What is measured or calculated | Unit |
|---|---|---|
| Uranium mass concentration | The amount of the element in a given volume of water | mg/L |
| Gross alpha activity | The activity of all alpha emitters included in the sample measurement | Bq/kg in the studies reviewed here |
| Annual effective dose | Radiation exposure for a specified isotopic composition and consumption pattern | mSv/year |
For example, a 2019 study reported a mean gross alpha activity of 3.01 ± 0.9 Bq/kg and a maximum of 5.2 Bq/kg for Krasnopolye. These measure a different quantity: they cannot be placed on the same scale as 0.061 mg/L of uranium.[6, Table 2]
Residents therefore need both answers: what the radiological assessment shows, and whether the water meets chemical standards. A favourable finding for one indicator does not cancel out an exceedance for another.
A new borehole and the crucial missing results
After the familiar water collection points were closed, work began on a new supply. The documents trace the replacement of the borehole and the installation of treatment equipment.
If the table is wider than the screen, scroll horizontally to see every column.
| Date or period | What the record shows |
|---|---|
| 1983 | The commissioning year of borehole No. 0618 in the earlier water supply plan for Krasnopolye Rural Council.[8, Table 3] |
| Spring 2021 | Reports of restrictions on water collection and arrangements for an alternative supply.[1] |
| 2021 | The commissioning year of borehole No. 786 in the published update to the plan.[9, Table 3] |
| 3 February 2022 | The newspaper Khakassia reported that a pumping station had been built and residents were still waiting for water to be supplied.[10] |
| 31 May 2022 | An official list of municipal assets being transferred included a BMS WT 5CE/S water treatment unit.[11] |
| 2024 | The district website published an updated plan containing the new borehole alongside some of the previous descriptions.[9] |
| First quarter of 2025 | A subsequent court judgment records that Impuls provided cold water supply services to Krasnopolye.[12] |
These documents matter both for the new infrastructure they record and for their inconsistent descriptions. The updated plan still bears the year 2014 on its title page. One passage says there is no preventive disinfection unit, while another describes ultraviolet disinfection already in use. Information about borehole No. 786 sits alongside old text stating that there is no water treatment.[9]
Naming the equipment does not tell us what happened to the uranium after treatment. That requires a consistent series of analyses covering the source, treated water and distribution network, with sampling dates, locations, results and methods.
The state report for 2022 again names Krasnopolye, Lukyanovka and Novorossiyskoye among the settlements with uranium exceedances. However, the relevant section summarises monitoring for 2018–2022 and does not identify which samples were collected after the new plant began operating.[13, PDF p. 153]
No publicly available series of results was found that would allow water quality to be traced from treatment through to today’s consumers. The water supplier is responsible for operational water quality monitoring. The municipality must publish information on the quality of the water supplied and on the implementation of plans to improve it. These are specific duties set out in Articles 25 and 23 of the law on water supply.[14][15]
The judgment in case А74-7838/2025 names Impuls, the municipal treasury enterprise of Altaisky District, as the operator in the first quarter of 2025.[12] The monitoring programme, test results and equipment specifications should be sought from the operator and the owner of the facilities; the original laboratory reports should be sought from the laboratories that performed the analyses. Residents need an accessible answer about what is being supplied to their homes now.
Geology that should come as no surprise
The region’s uranium mineralisation has long been known. In 1925, S. M. Kurbatov published a paper on uranium and vanadium compounds in Minusinsk Uyezd. It described findings from a 1919 visit to the area around Potekhina and the Yuliya mine.[16] This is a separate geological site, but it shows how far back the study of radioactive mineral resources in the region goes.
The Primorskoye and Oglakhtinskoye uranium deposits appear in documents concerning Bogradsky District.[17] The overview map marks them separately from the coal mines near Krasnopolye. A catalogue point marks a site’s location, not the boundaries of a deposit.
In May 2021, MK in Khakassia, citing RTS, reported a six-kilometre uranium vein in the Krasnopolye area.[18] The available article provides no geological cross-section, coordinates along the vein, depth or sampling results. Establishing its location requires the original geological report or site record. Such records are compiled by the organisation carrying out the work and deposited in geological archives. The map shows only sites for which location coordinates are available.
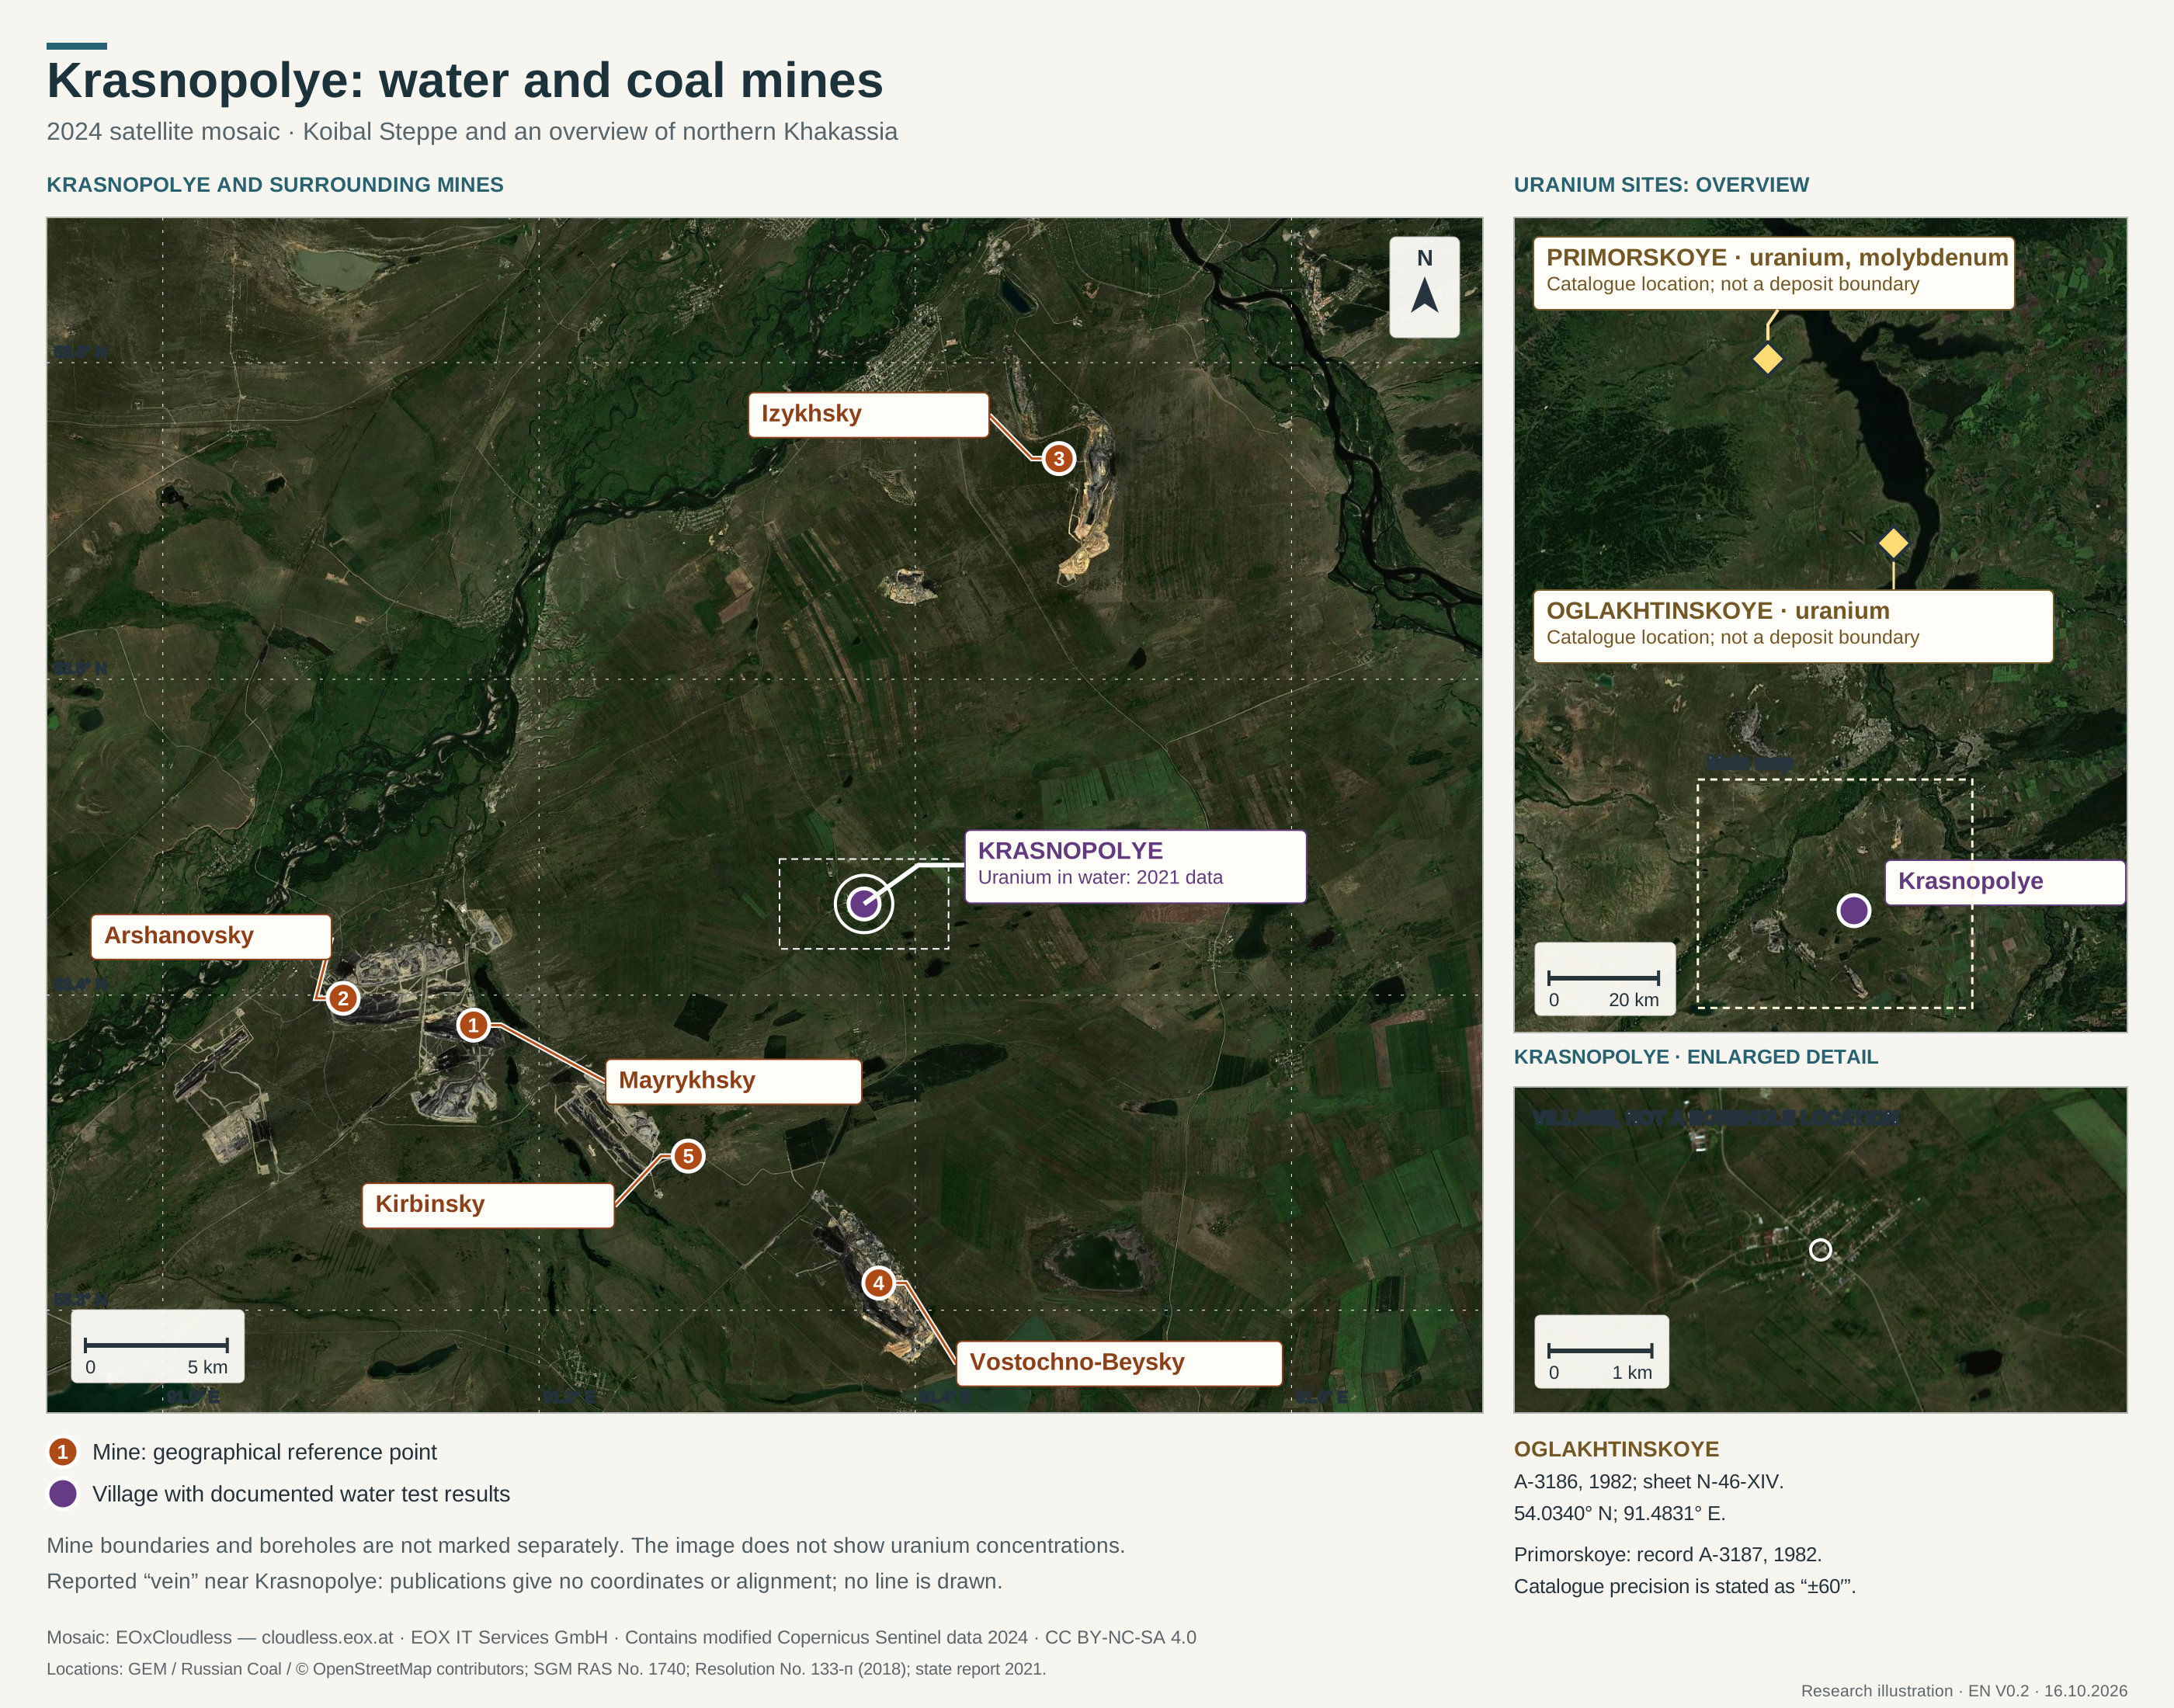
Krasnopolye and the surrounding mines on a 2024 satellite mosaic. Primorskoye and Oglakhtinskoye appear in a separate inset. The settlement and mine locations are marked; the coordinates of drinking water boreholes are not specified on this map.
Kirbinsky, Vostochno-Beysky, Mayrykhsky, Arshanovsky and Izykhsky open-pit mines lie near Krasnopolye. The straight-line distances between the published village location and the points marking these sites are approximately 11–20 kilometres. An official description is also available for Kirbinsky’s heavy machinery site: the plot is 10.9 km south-west of the village.[64]
These are distances across the surface. Underground, water movement depends on water-bearing rocks, their permeability and hydraulic heads. Understanding what happens requires looking not only at where the pits are, but also at what they cut into and how they manage water.
What comes out of the ground with the coal
Coal-bearing strata are not a solid mass of pure coal. Coal seams are separated and interspersed with rock partings. In their description of the Beyskoye deposit, researchers identify 40 coal seams, 0.6–12 metres thick, and another 22–25 thinner seams. They also identify 42 tonsteins: layers of altered volcanic ash.[19, pp. 157–158]
A 2019 paper by A. V. Vergunov, S. I. Arbuzov and V. M. Sobolenko reports uranium measurements in eleven tonstein samples from the Beyskoye deposit: 6.0–53.3 mg/kg of rock. These are measurements in rock, not an average for a commercial consignment of coal.[19, Table 4]
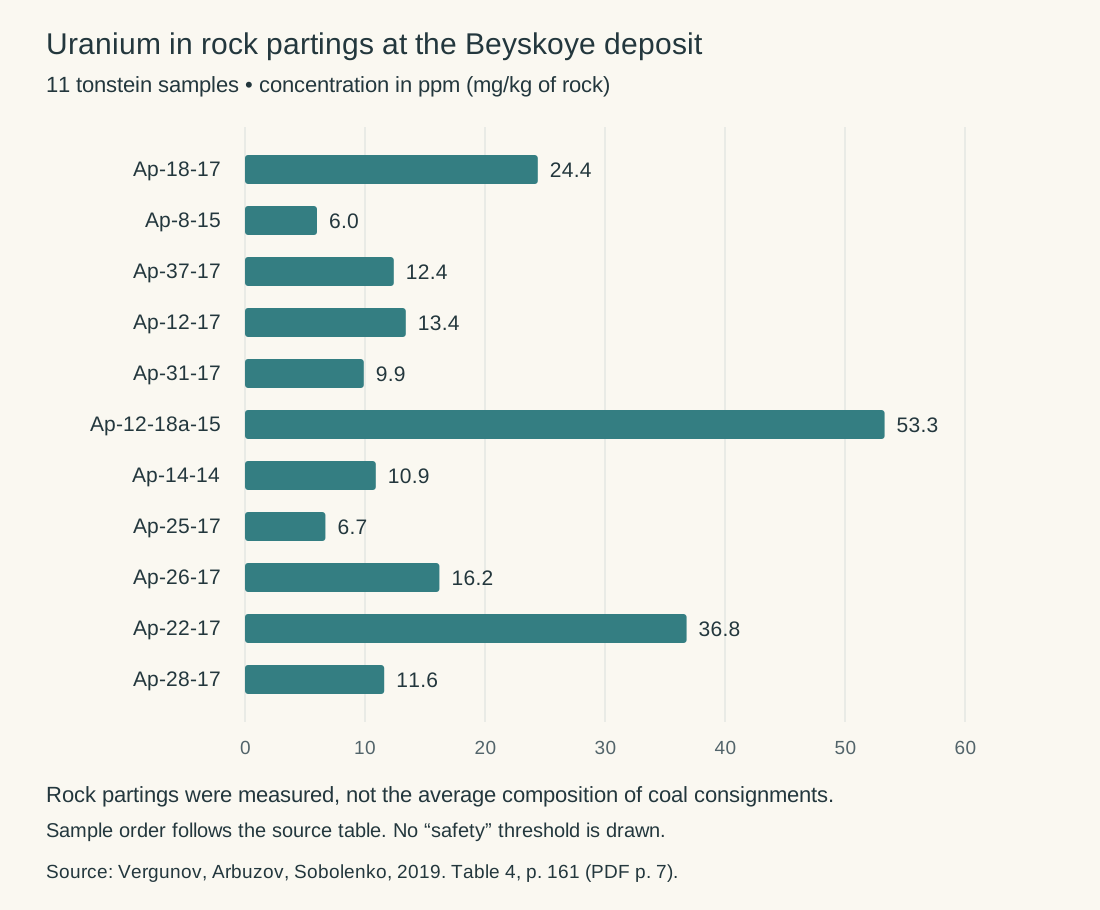
Results from a study of rock partings. The ppm notation in the source table is numerically equivalent to mg/kg. Geochemical reference values have not been used as a health-based limit.
For Mayrykhsky, this is not an abstract issue. The project to expand its coal loading facility with FGX units describes the complex, banded structure of the seams and the non-selective extraction of coal together with rock partings. Rock enters the mined material, which then requires processing to separate it from the coal.[20, PDF p. 21]
Uranium therefore needs to be traced through the processing chain: the material as mined, the coal product, screened fines, separated rock, dust and, ultimately, ash at the consumer’s site. Such a comparison requires samples from the same chain with a known origin. These records are generated by the producer, the sampling organisation and the testing laboratories; the characteristics of the delivered consignment also form part of the buyer’s documentation.
Another paper, on the Izykh syncline, describes a 0.45 m thick siltstone parting with a reading of 25 µR/h. It was studied as a particular layer within a geological section.[21, PDF p. 7] Such a record matters when selecting sampling locations: different parts of the coal-bearing sequence may have different properties.
Radiological tests of coal do exist
S. A. Kyrova’s 2005 dissertation abstract reports tests of several commercial size grades of Izykhsky coal. Their effective specific activity was approximately 36–52 Bq/kg, using the central values. The author compared the results with the criterion applied in the study and reached a favourable conclusion on the radiation safety of the coal tested.[22, Table 6]
Combustion residues were examined separately. The Izykhsky ash and slag residue tested measured 299.2 ± 61.256 Bq/kg, while Stepnoy’s measured 108.95 ± 26.986 Bq/kg. A further test of Stepnoy ash gave 188.4 ± 37.68 Bq/kg. The author recommended systematic monitoring of the residues, taking radiometric anomalies into account.[22, Tables 7–8]
The whole sequence matters, including the favourable results for the coal samples. When coal burns, most of the organic fuel is consumed, while mineral components remain in the residues. A coal quality certificate and an ash analysis therefore answer different questions. The U.S. Geological Survey likewise treats coal and fly ash as separate subjects when assessing radioactive elements.[24]
What the Mayrykhsky documents revealed
The environmental impact assessment (EIA) for the coal loading facility includes a radiation survey of the site: the mean gamma dose rate was 0.13 µSv/h, with a range of 0.08–0.18 µSv/h. The report describes a survey on a 10-metre grid and an additional walkover search. This measures the external gamma background at the surveyed site.[20, PDF p. 44, §3.6]
Another volume contains test report No. 965 for Mayrykhsky coal consignment 0198, grade DOMSSh (ДОМСШ), 0–50. The sample was collected on 10 January 2020. Testing was performed by the Novokuznetsk and Novokuznetsk District branch of the Centre for Hygiene and Epidemiology in Kemerovo Region; SGS Vostok Limited JSC was the applicant. The tables list potassium-40, radium-226, thorium-232 and effective specific activity.[23, PDF pp. 34–35]
The report contains two internal discrepancies. Its first page is dated 22 January, while the second gives 23 January as the date testing ended. The five effective activity values — 35, 24, 39, 37 and 37 Bq/kg — have an arithmetic mean of 34.4; the summary row gives 19 ± 9 Bq/kg. The two pages do not explain how that final figure was obtained.[23]
The laboratory that prepared the report and the client that commissioned the tests should explain the calculation and the dates. The test itself remains part of the record. Its scope must also be kept clear: it concerns a particular consignment and the listed radionuclides, not direct analyses of uranium-238 and uranium-234 in all the mine’s products.
The available documents contain no separate series of radionuclide analyses of FGX dust. The producer and the operating company should disclose what tests were performed on the dust and separation products, under which programmes, and where the results are held. A visible plume shows an emission; laboratory analysis establishes its composition.
Water does more than leave the mine
Pumping makes a pit a point towards which water flows. Water levels around it fall, a cone of depression develops, and flow directions change in connected water-bearing rocks. Our previous investigation into groundwater in the Koibal Steppe examines this process. But there is another side to it: where the water pumped out of the pit goes.[25][27]
The state subsoil monitoring bulletin for 2018 describes the arrangements at Izykhsky mine. Drainage water was piped into artificial excavations used as storage basins. Some evaporated, but most of the water discharged within the mining allotment infiltrated the water-bearing Carboniferous strata. The same description appears in the bulletin for 2020.[25][27, PDF p. 74]
In other words, the water followed this route:
Pit dewatering → pipeline → storage basin or discharge onto the ground → infiltration into water-bearing rocks.
This is a documented process, not an inference from a satellite image.
At another site in Khakassia, Abakansky mine, monitoring for 2019 described the opposite of a cone of depression: a groundwater mound up to 600 metres long and 400 metres wide. It formed through seepage from a settling pond. Pumping lowers the water level in one place; the return of water raises it in another.[26, PDF p. 72]
The 2018 bulletin also links changes in groundwater chemistry around the mines to water being drawn up from deeper strata as a result of dewatering.[25, PDF p. 76] This is another mechanism: mining changes not only how much water there is, but also which rocks it comes from.
Reservoirs also require geographical precision. A paper by V. S. Kuskovsky describes the rise in groundwater levels around the Krasnoyarsk Reservoir: along the profiles studied, the influence extended 2.5–3.8 km into Devonian strata and 3–5 km into Carboniferous strata. It describes water infiltrating the banks.[28, pp. 216–217] These distances relate to the shoreline profiles studied at the Krasnoyarsk Reservoir, not to the Sayano-Shushenskaya hydropower plant.
For Altaisky District itself, the spatial planning scheme describes aquifer recharge from precipitation, through-flowing groundwater and surface water, with discharge into the alluvial deposits of the Abakan and Yenisei rivers, local watercourses, lakes and drainage channels.[29, PDF p. 10]
Tracing the pathway to Krasnopolye’s drinking water borehole requires its technical record and intake depth, the locations of storage basins and discharge outlets, simultaneous water-level measurements and comparable analyses. These records are not available as a connected public dataset. Companies hold records of their own drainage systems and site monitoring; the owner and operator of the drinking water abstraction facility hold the borehole records and results of supply monitoring; the results of completed geological surveys are deposited in the relevant archives. These are the records needed to answer residents’ questions.
The presence of natural uranium does not make changes to groundwater conditions inconsequential. It makes monitoring which waters reach the abstraction point after mining disturbs the ground especially important.
How coal production grew near the village
According to state reports, Mayrykhsky’s output rose from 0.441 million tonnes in 2016 to 4.239 million tonnes in 2019. Arshanovsky’s rose from 2.364 million tonnes in 2016 to 4.482 million tonnes in 2021. Kirbinsky entered this series with 0.073 million tonnes in 2018; the report for 2022 gives 2.459 million tonnes.[30]
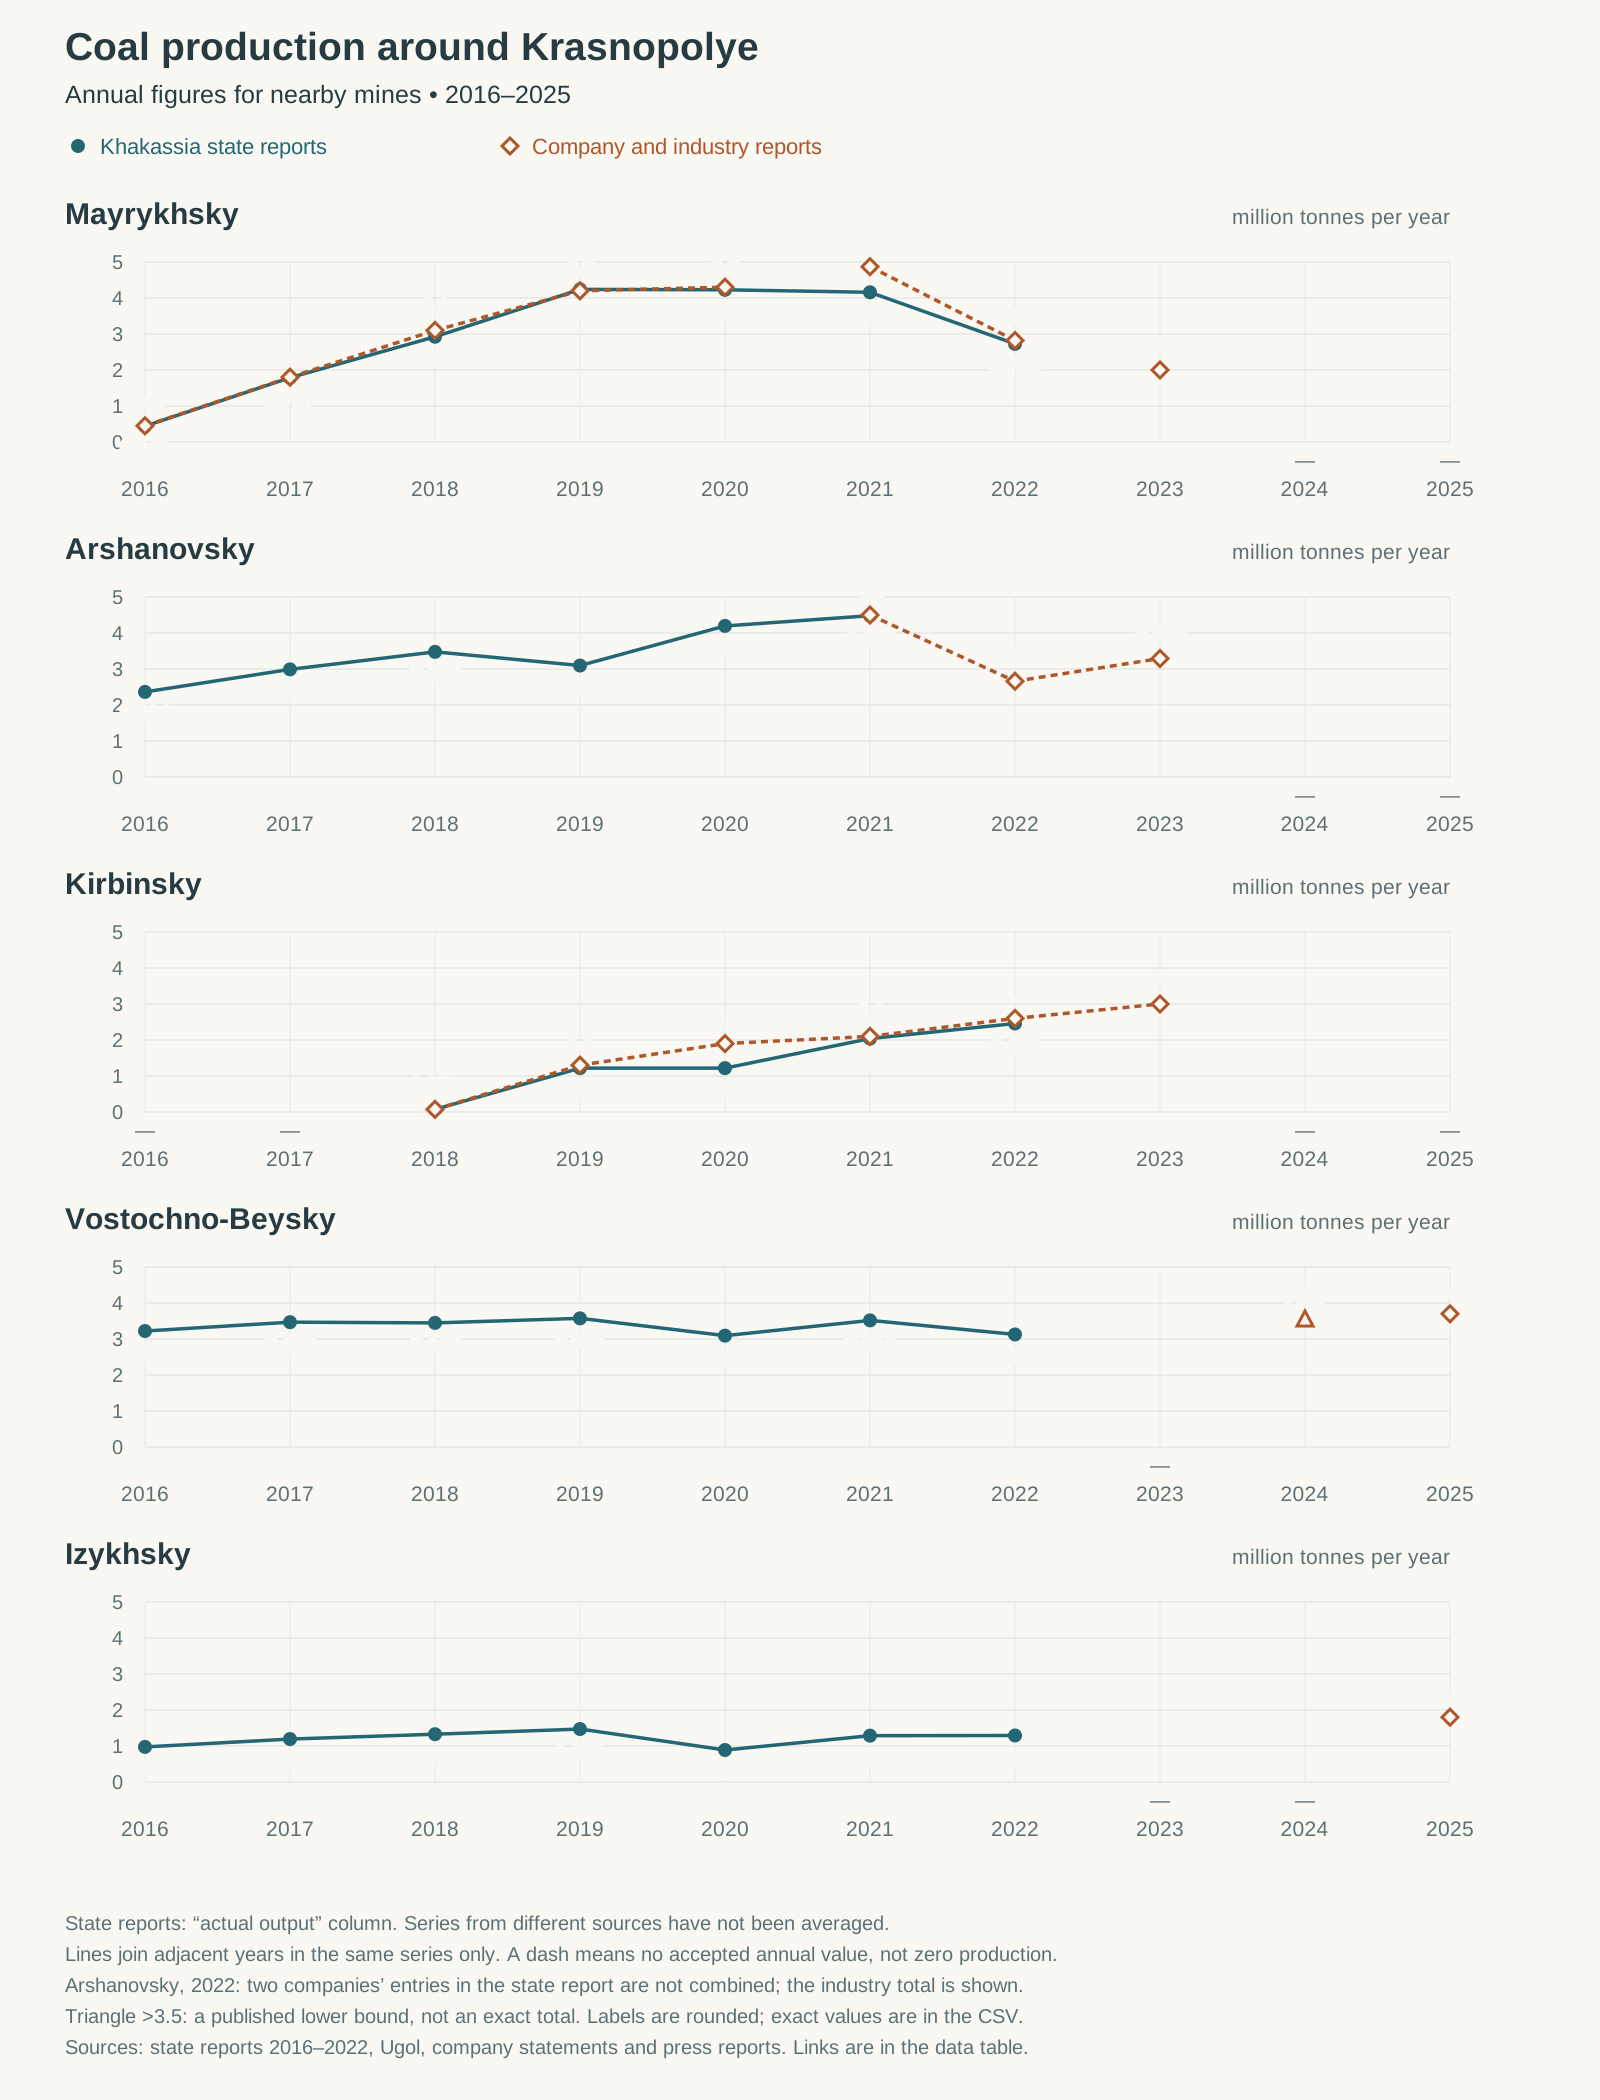
Data from state reports, with company and industry publication figures shown separately. A dash indicates the absence of a comparable full-year value in the compiled series. The original figures, documents and page references are available in the data table.[30–33]
Output did not move in the same direction every year. In 2023, an industry table puts Arshanovsky’s production at 3.292 million tonnes, 23.7% above the previous year. Kirbinsky reported about 3 million tonnes, compared with 2.6 million in 2022. For Mayrykhsky, by contrast, an industry review reported about 2 million tonnes and a decline of 29%.[31–33]
Sources sometimes disagree on the absolute totals as well. For Kirbinsky in 2020, for example, the state report gives 1.219 million tonnes, while a company statement gives 1.9 million. The chart retains both entries separately. Averaging them would not produce a supposedly more reliable figure.[30]
The republic-wide series shows the overall scale: 18.015 million tonnes in 2016, 28.939 million in 2021 and 24.721 million in 2025. The increase between the first and last points is 37.2%, although production fell after its peak.[30][34]
These were years of intensive industrial change across the area. Its health history needs to be examined over that whole period and earlier, rather than by selecting a single year with a convenient coincidence.
What became of the residents’ medical examinations
The figures below describe the health of the district’s and the republic’s populations. They cannot isolate the effects of drinking uranium-containing water: that requires information on specific water sources, duration of exposure and other risk factors.
On 22 April 2021, the newspaper Khakassia reported that a medical team was working in Krasnopolye. Beloyarskaya District Hospital and the Health Centre appear in the accounts of these examinations.[35]
The material collected contains no publicly available final anonymised summary of the examinations: how many people were examined, what health problems were found, who was referred for further diagnosis and what follow-up took place. This is a specific missing result, not a claim that no doctors visited the village.
The organisations that conducted the examinations are responsible for the medical records; health authorities are responsible for the required regional reporting and its compilation. Public analysis needs anonymised findings, not the publication of personal medical records.[35][63]
What is available is the broader picture for Altaisky District, Khakassia and Russia. It is especially important not to label the entire category of genitourinary diseases as “kidney disease caused by uranium”. It combines different diagnoses.
If the table is wider than the screen, scroll horizontally to see every column.
| Year | Altaisky District | Khakassia | Russia |
|---|---|---|---|
| 2016 | 50.0 | 113.0 | 116.0 |
| 2017 | 52.2 | 125.1 | 115.9 |
| 2018 | 67.8 | 123.3 | 117.9 |
| 2019 | 67.6 | 117.5 | 118.9 |
| 2020 | 54.7 | 93.0 | 102.1 |
| 2021 | — | — | 105.2 |
| 2022 | 56.5 | 91.7 | 106.5 |
| 2023 | 133.1 | 95.2 | 112.1 |
| 2024 | 80.2 | 91.6 | 114.7 |
| 2025 | 115.6 | 102.2 | — |
All registered cases of genitourinary disease per 1,000 residents. The national figures have been converted to this unit and rounded to one decimal place; exact values and page references are in the comparison table. Gaps indicate missing comparable entries in the sources used. The Russian series for 2020–2024 comes from a Rosstat publication using revised population estimates.[30][34][36]
In 2023, the district’s rate was about 40% above the republic-wide rate and 19% above the Russian rate. Yet in 2024 it fell to 80.2, before rising to 115.6 in 2025. Before the 2023 jump, the district values shown were below both benchmarks. This is a history of fluctuations in recorded disease, not a steadily rising line.
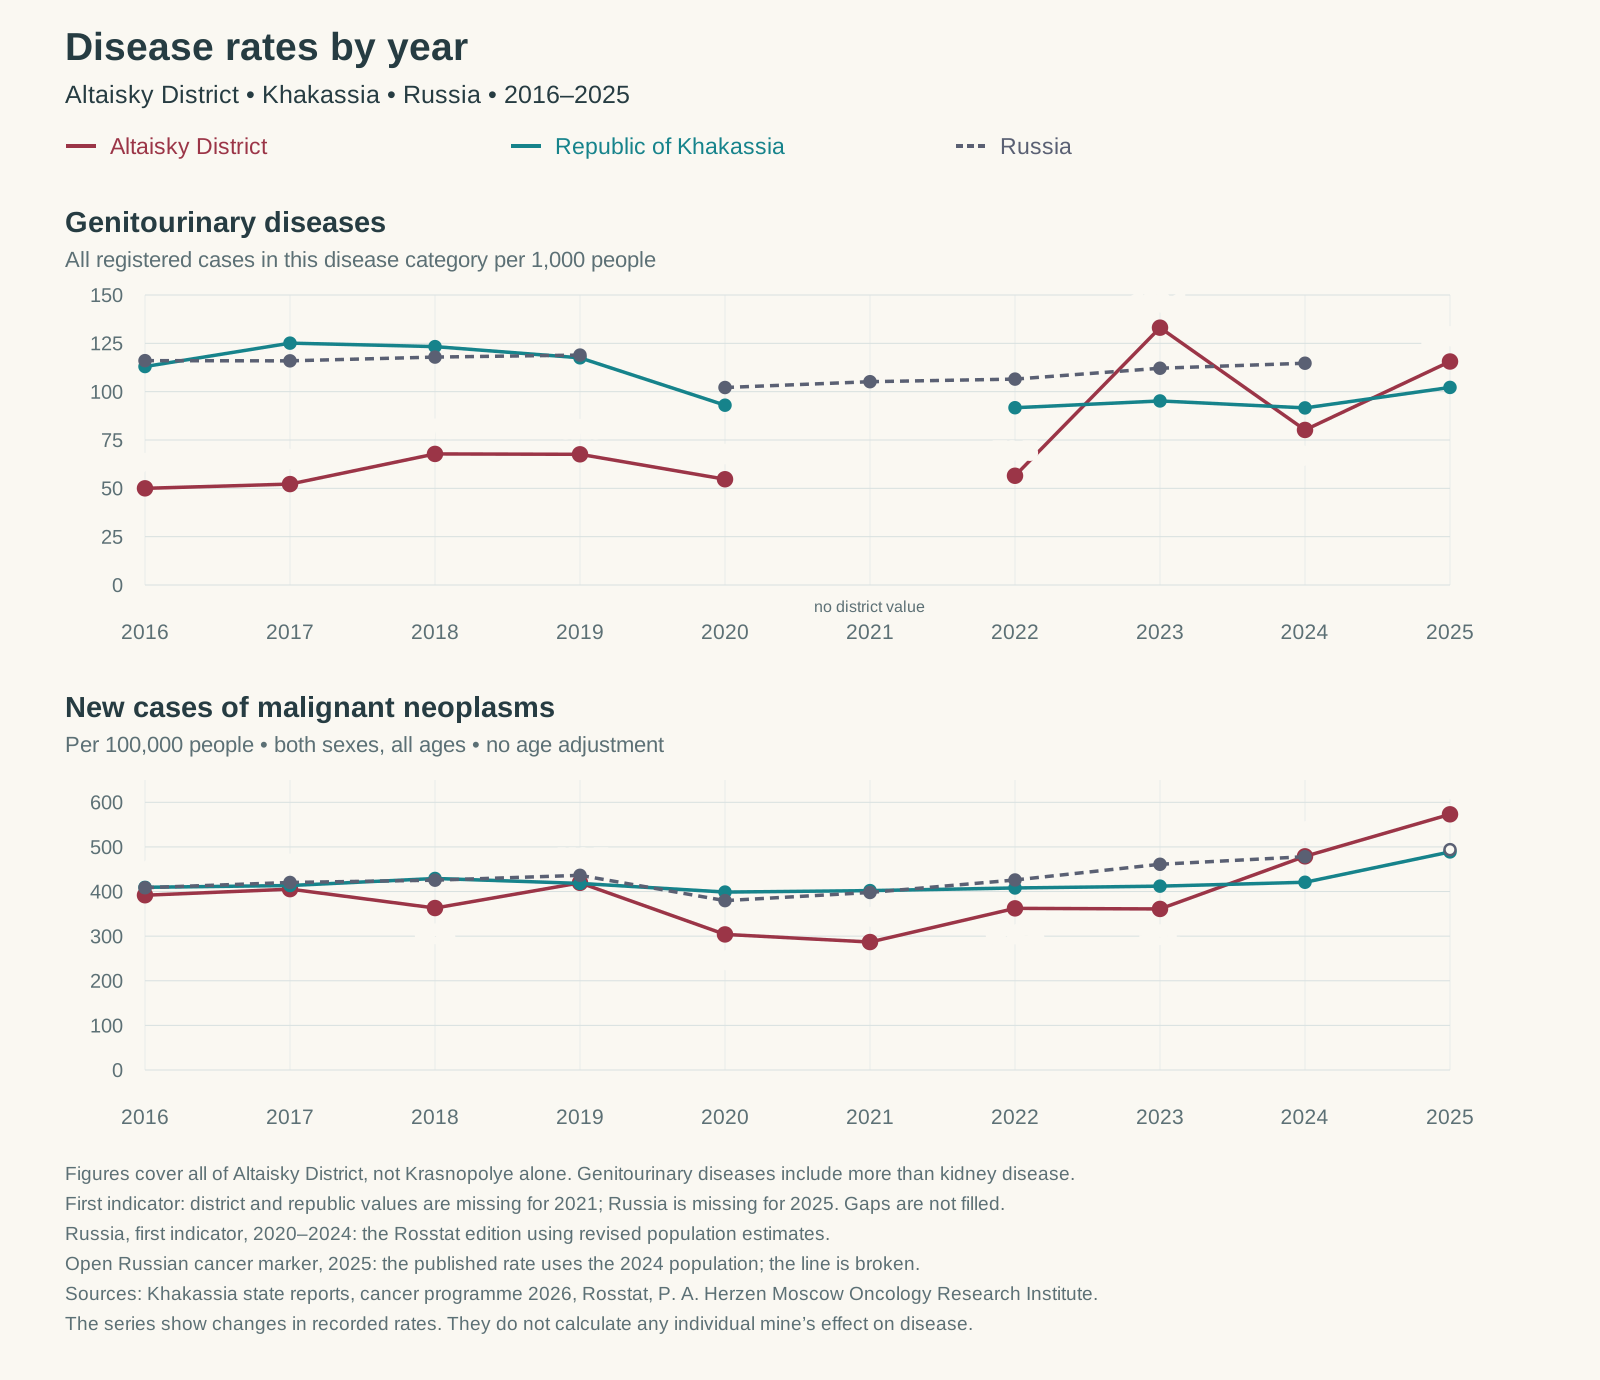
Two separate indicators: all registered genitourinary diseases and newly diagnosed malignant neoplasms. Each panel specifies its units and geographical coverage. The particulars of the cancer series are explained below.[30][34][36–39]
Cancer by district, year and diagnosis
WHO notes that data on uranium’s carcinogenicity in humans and experimental animals are insufficient. The drinking water guideline value is based on chemical toxicity, primarily its effects on the kidneys.[7]
Altaisky District and the rest of the republic
In a table covering 2015–2024 from a draft regional programme published by the Ministry of Health in May 2025, Altaisky District’s rate rose from 331.3 to 478.9 new cases of malignant neoplasms per 100,000 people. In 2024, this was the highest value among Khakassia’s eight districts. Among all municipalities, including cities, Sayanogorsk was higher at 499.6.[40, Table 2]
The geographical picture cannot be reduced to a single high figure. For the administrative areas containing the seven settlements identified as exceeding the limit in the water study, the health table looks like this:
If the table is wider than the screen, scroll horizontally to see every column.
| Administrative area | Settlements listed as exceeding the uranium limit | New cases of malignant neoplasms per 100,000 people in the area, 2024 |
|---|---|---|
| Altaisky District | Krasnopolye, Lukyanovka, Novorossiyskoye | 478.9 |
| Ust-Abakansky District | Moskovskoye | 427.5 |
| Beysky District | Novotroitskoye | 394.3 |
| Bogradsky District | Bograd | 360.7 |
| City of Sorsk | Sorsk | 251.9 |
| Republic of Khakassia | Republic-wide benchmark | 421.7 |
Sources: the water study [3] and the municipal cancer incidence table [40]. The health figures cover the entire populations of the named areas, without age adjustment. All 140 values for the ten years are retained in the full district table.
In the same programme, Altaisky District exceeds the republic-wide rate in only two of the ten years: 2019 and 2024. Beysky District does so in seven. These differences matter: one district cannot stand for all of Khakassia, nor can one borehole represent every exposure experienced by its residents.[40]
In the next published series, the 2026 programme, Altaisky District records 573.1 new cases per 100,000 people in 2025, and Khakassia 488.8. The Russian statistical compilation reports 493.9; this national rate divides the number of cases in 2025 by the mean annual population for 2024.[37][39]
To compare the series without selecting only the latest point:
If the table is wider than the screen, scroll horizontally to see every column.
| Year | Altaisky District | Khakassia | Russia |
|---|---|---|---|
| 2016 | 391.7 | 409.5 | 408.62 |
| 2017 | 405.4 | 413.5 | 420.30 |
| 2018 | 363.0 | 429.3 | 425.46 |
| 2019 | 419.5 | 418.2 | 436.34 |
| 2020 | 303.9 | 398.8 | 379.65 |
| 2021 | 286.8 | 402.1 | 397.91 |
| 2022 | 362.3 | 408.0 | 425.89 |
| 2023 | 361.0 | 412.1 | 461.10 |
| 2024 | 478.9 | 420.8* | 478.11 |
| 2025 | 573.1 | 488.8 | 493.90** |
Newly registered malignant neoplasms per 100,000 people, both sexes and all ages, without age standardisation.[37–39]
The value of 420.8 from municipal Table 2 of the 2026 programme is retained here. Its Table 3 and the previous programme give 421.7. The discrepancy between the published tables has not been removed by arbitrarily choosing one figure. The chart uses Table 2.
The particular population denominator used for the national 2025 rate is explained above; the chart separates this point from the preceding series.
What doctors and researchers found
Some studies allow us to look beyond the latest annual reports. In a paper by L. D. Zhuikova and colleagues, Khakassia’s age-standardised cancer incidence rose from 169.1 per 100,000 people in 2005 to 269.9 in 2018, an increase of 59.6%. Age adjustment helps distinguish a change in the rate from the effect of population ageing alone.[41, Table 1]
A monograph on kidney cancer gives Khakassia’s average age-standardised rates over five-year periods. For men, the figures were 7.3 per 100,000 in 2001–2005 and 14.0 in 2011–2015; for women, 4.3 and 9.0, respectively. This is a long-term rise that began well before Mayrykhsky’s new units started operating.[42, Tables 12 and 14]
A breast cancer study found that the republic’s age-standardised rate rose from 32.2 in 1999 to 48.2 in 2013 per 100,000 women.[43] A dissertation abstract on stomach cancer describes higher incidence in Khakassia than the Russian average and an upward trend during 2002–2012; at the same time, the author notes improvements in early detection and treatment outcomes.[46]
Studies of central nervous system tumours are particularly important. For 2010–2019, researchers recorded rising age-standardised rates in Khakassia. For a different period, 2013–2022, a later study shows a decline that was not statistically significant, and discusses problems with the completeness of registration.[44][45] This is a reason to examine the quality of recording, not to select only the more alarming trend.
Coal production and six cancers on the same timeline
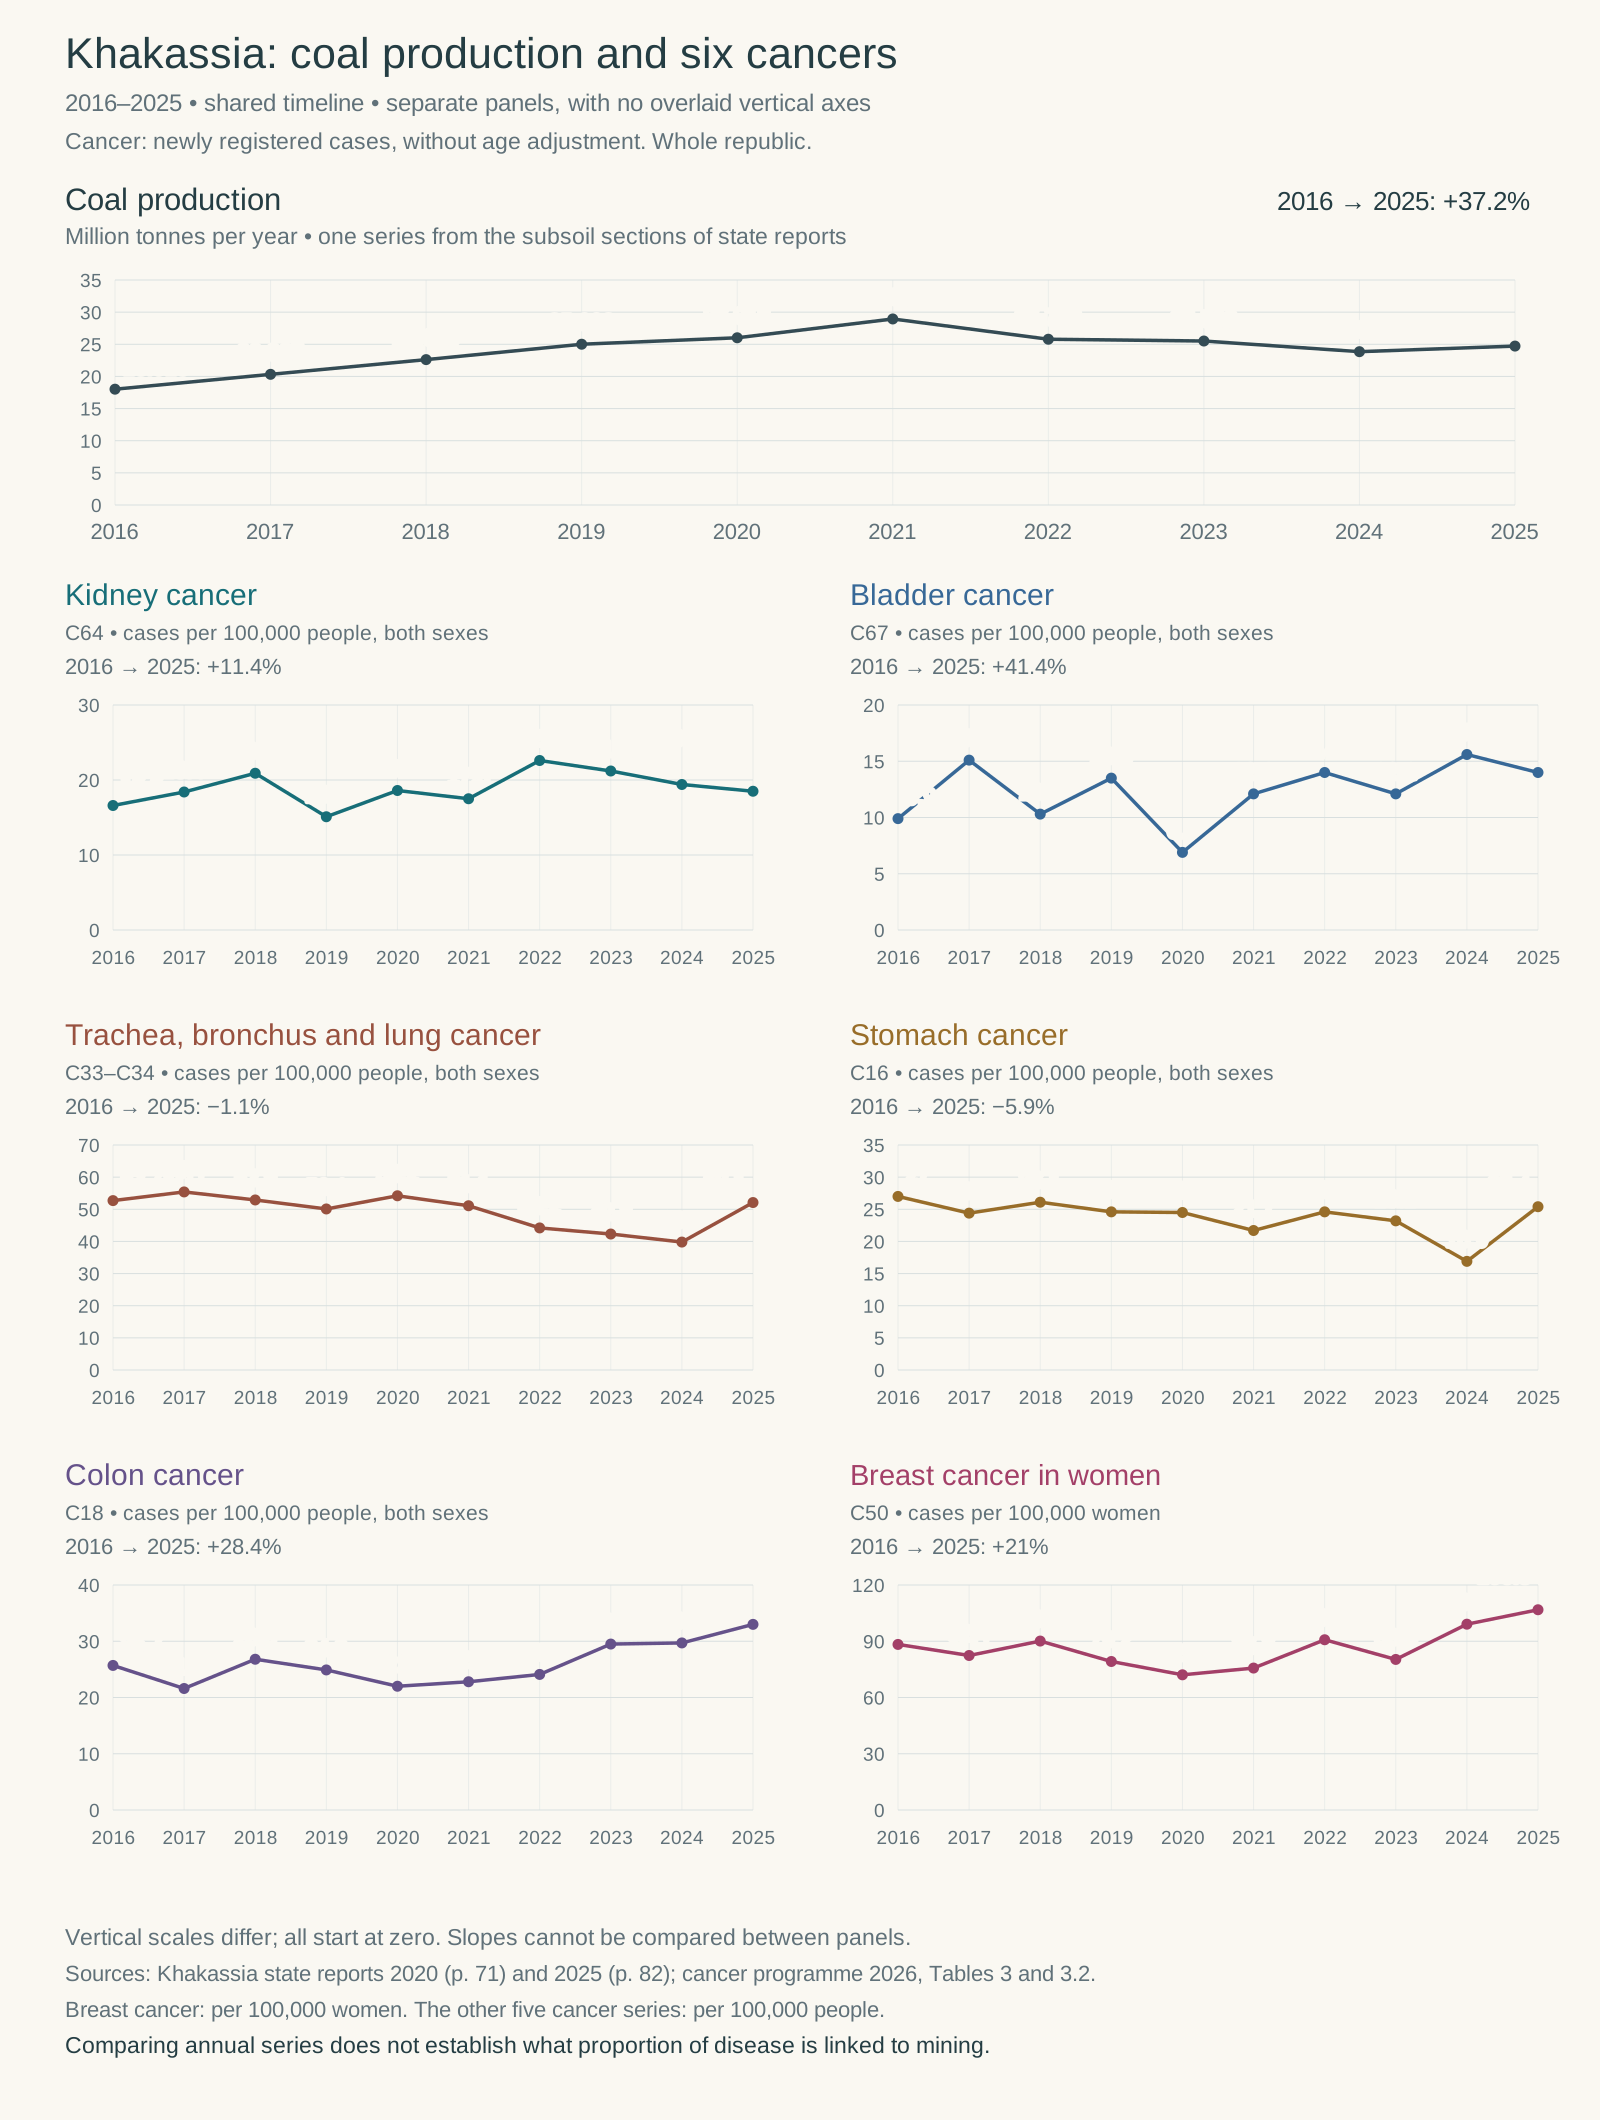
Khakassia, 2016–2025. At the top: coal production in millions of tonnes. Below: new cases of six types of cancer. For breast cancer, the denominator is 100,000 women; for the other panels, it is 100,000 people of both sexes. The vertical scales differ. Chart figures and sources.[30][34][37]
Over this period, the rates for kidney, bladder, colon and breast cancer increased between the first and last points. For stomach cancer and the “trachea, bronchus and lung” group, the final values are slightly below the initial ones. Every series fluctuates; they do not follow a common pattern with coal production.
Charts like these show the timing and scale of changes. Understanding causes also requires age, place of residence and work, water supply history, duration of exposure, the quality of detection and possible disease latency. A fall in registered diagnoses during the pandemic cannot simply be read as an improvement in health either: Russian researchers linked it to poorer detection and reduced access to planned care.[47]
We found no publicly available anonymised series for residents of specific villages or users of the water abstraction facilities studied. The medical records underlying such series should be compiled by healthcare institutions and the cancer registry, while the water data should be held by the operator, laboratories and sanitary authorities. What is missing is an accessible comparison of these records. A district table cannot replace it, nor does it remove the need for such monitoring.
Children, congenital anomalies and pregnancy outcomes
Children cannot be left out of this story. But first we need to specify what is being counted: congenital anomalies in children, abnormalities detected before birth, terminations following diagnosis, spontaneous pregnancy losses and infant deaths. These terms represent different families and different medical events.
Which anomalies were recorded most often
L. I. Minaycheva’s dissertation contains data for Abakan for 1986–2001: 39,363 births and 1,049 recorded congenital anomalies across the full spectrum. Both live births and stillbirths were included.[48]
The highest mean frequencies in the author’s classification were as follows:
If the table is wider than the screen, scroll horizontally to see every column.
| Anomaly group | Mean frequency per 1,000 newborns ± standard error |
|---|---|
| Musculoskeletal system | 7.062 ± 0.506 |
| Genital organs | 4.312 ± 0.319 |
| Urinary system | 3.070 ± 0.474 |
| Cardiovascular system | 2.814 ± 0.402 |
| Central nervous system and sensory organs | 2.289 ± 0.342 |
| Multiple congenital anomalies | 2.112 ± 0.490 |
| Face and neck | 2.109 ± 0.542 |
Historical series for Abakan, Table 14, pp. 94–95.[48] All 14 groups are retained in the data table. This is the historical ranking by group found in the source, not a current ranking for Krasnopolye.
A later regional programme provides a different measure: causes of infant deaths. For 2018–2021, it examines 19 children who died from congenital anomalies. Of these, 12 had heart defects, two had Edwards syndrome, two had kidney anomalies, two had gastrointestinal anomalies and one had a central nervous system anomaly.[49] Heart defects were the leading group here, but this is the distribution of deaths, not of all congenital abnormalities.
Terminations following prenatal diagnosis
Official documents also contain information on this part of the medical history. In 2012, 34 pregnancies in Khakassia were terminated following diagnosis: 13 involved chromosomal abnormalities and 21 congenital anomalies incompatible with survival. For the first nine months of 2013, the documents record 22 terminations: five involving chromosomal abnormalities, 13 congenital anomalies, and four severe embryonic or foetal disorders without congenital anomalies.[50]
These are recorded terminations on medical grounds, not counts of miscarriages. The full year and the nine-month period are kept distinct.
Recent scientific studies also exist. A 2023 study analyses multiple congenital anomalies across 23 registries, but Khakassia is not among them. A 2025 publication including data for Khakassia concerns infant and perinatal mortality, not a complete ranking of anomalies.[54][55]
The material collected contains no current public summary for Khakassia that shows the type of anomaly, the mother’s place of residence, pregnancy outcome and number of births together. Healthcare organisations keep the primary records; the clinical genetics service and prenatal consultation panel deal with identified abnormalities. Regional data should be compiled within the healthcare system through the required reporting procedures.[49][50][63] Research needs anonymised tables, not patients’ names.
What is known about uranium exposure
In a study published in 2022, Yin and colleagues compared 408 cases of neural tube defects with 593 controls in a rural area of northern China. Uranium was measured in placental tissue. For the group with the highest concentration compared with the lowest, the adjusted odds ratio was 3.60, with a 95% confidence interval of 2.30–5.64. This is the result of a case-control study, as reported in the available abstract.[51]
Another study, in rural Nebraska, produced a more complex picture: a positive association between uranium and congenital anomalies in one model became negative when other variables were included. The authors discussed pregnancy losses as a possible explanation, but did not measure such losses themselves. Moreover, the birth data covered 1995–2014, while the water samples were collected in 2021–2022.[52]
For radiation exposure, both dose and the stage of pregnancy matter; a uranium concentration in milligrams per litre is not itself a foetal dose.[53] The international studies therefore raise specific questions for monitoring; they do not provide a ready-made count of affected children in Khakassia.
The exceedances already recorded in the drinking water source are sufficient grounds to demand proper monitoring and a supply of water that meets quality standards. Residents should not first have to produce statistics on anomalies in their children for their water problem to merit attention.
Who received Khakassia’s coal
The coal story does not end at the mine boundary. There is a producer, a carrier, a trading intermediary, a buyer and a site where the fuel is burned. Each stage leaves documents that can be used to trace a consignment’s origin and the tests performed on it.
Buyers named in the documents
Mezhregiontop LLC. The judgment of the Commercial Court of the Republic of Khakassia of 1 September 2025 in case А74-12368/2024 describes contract No. 115-2022 with Mayrykhsky, dated 2 December 2022, and three signed delivery notes for supplies on 17 December 2022, 22 January and 30 June 2023.[56] This establishes a specific link between seller and buyer.
CSTI Limited. In its own report on a visit by company representatives, Mayrykhsky described CSTI as its main buyer.[57] The Cypriot company CSTI LIMITED, registration number HE380523, was renamed AMS FELICITY LTD in 2023, and in 2026 the official gazette reported its members’ decision to begin voluntary liquidation.[58] Contract details are needed to confirm that this particular legal entity was the one dealing with Mayrykhsky.
BX Energy Limited. Court records document a contract with Stepnoy Open-Pit Mine Coal Company JSC dated 28 October 2021 and a subsequent dispute.[59] The contractual counterparty is established; the actual consignments and receiving power stations belong to a separate part of the supply documentation.
Some end users are named directly. The technical operating regulations for Barnaul CHP-2 describe the combustion of Khakassian grade D coal together with Kuznetsk grade SS coal.[60] OGK-2’s annual report for 2013 lists Stepnoy, Chernogorsk Coal Company, Khakasrazrezugol and Vostochno-Beysky among the suppliers to Cherepovets GRES power station.[61] These records relate to the periods concerned; they are not a list of current supplies.
The international supply chain
The trade data aggregator Trademo lists The National Coal Supply Corporation Ltd — NCSC — as a buyer from Mayrykhsky, alongside CSTI and Ecocarbon.[62] The underlying transport documents for these entries were not found in public sources, so the aggregator’s information requires confirmation from the companies named.
NCSC’s role is independently confirmed by Israel Electric Corporation’s report for 2023: the company supplies coal to Orot Rabin and Rutenberg power stations. The report lists Russia among the main countries of purchase.[62] Linking a particular Mayrykhsky consignment to a particular power station requires the documents for that shipment.
Additional sources mention Novosibirsk CHP-2 and CHP-4, Apatity and Artyom CHP plants, Magadan, Inta and Sorsk CHP plants, and Severodvinsk CHP-1, as well as the trading company TAQA SOLUTIONS DMCC. The evidence varies: industry reports, planning schemes, announcements of intended fuel switches and trade profiles. The list of companies and evidence of their links identifies the basis for each entry: a confirmed shipment, a report naming a consumer, or information about possible purchases that has yet to be confirmed.
What I want to ask the buyers
I want to contact the companies that bought, or may have bought, this coal. I will not ask them to take my concerns on trust, but to answer questions that should be addressed by documents:
- Which mine and consignments supplied the fuel, who acted as intermediary, and where was the coal delivered?
- How were samples collected, and which chemical and radionuclide indicators were tested?
- Which methods and criteria were used to judge the fuel’s suitability?
- Can the test reports, sampling dates and consignment numbers be made available?
- What tests were carried out on ash, slag and water at the site where the coal was used?
No letters on this subject have yet been sent. This is a next step, not correspondence that has already taken place. The supplier, buyer and laboratory hold different parts of the answer; a single promotional specification sheet cannot replace them all.
Who is responsible for the information residents cannot see
This story already includes laboratory results, scientific papers, state reports and company documents. The problem is not a complete absence of information. It is that essential parts do not form an accessible picture for residents: what water was supplied, what was changed, what is being supplied now, and how people’s health was followed up.
The law on water supply assigns responsibilities quite clearly. The water supplier carries out operational water quality monitoring. Its programme specifies indicators, sampling locations and frequency, and must be agreed with the territorial sanitary authority. Where the prescribed grounds exist, the regulator can expand the list of indicators and increase the sampling frequency.[14]
At least once a year, the municipality must publish information on the quality of centrally supplied drinking water, plans to improve it and the results of their implementation. Where a significant deterioration in quality is identified, the law separately requires the public to be informed.[15]
If the table is wider than the screen, scroll horizontally to see every column.
| Residents’ question | Who is responsible for the relevant information |
|---|---|
| What is in the source water, treated water and distribution network? | The operator organises operational water quality monitoring; accredited laboratories perform the analyses; Rospotrebnadzor agrees the programme and exercises sanitary oversight.[14] |
| Where can people see water quality results and the measures taken? | The municipality publishes the information required by law and informs residents of deterioration.[15] |
| How are the borehole and treatment plant designed? | The owner, operator, commissioning client and contractor hold the relevant technical specifications, designs, handover records and test records. |
| What did the medical examinations show, and how are diagnoses changing? | Healthcare organisations keep medical records and submit the required reports; specialist services and the Ministry of Health compile data within their respective functions. Publication requires anonymised information.[63] |
| Where does the company pump and discharge water, and what do monitoring boreholes show? | The subsoil licence holder and the organisations undertaking its design and monitoring work compile site-specific records; documents obtained by a regulator are also held by that authority. |
| What was tested in the coal supplied and in the residues from its use? | The producer, buyer, sampling organisation and laboratory hold the relevant information in consignment documents, contracts and test records. |
Public access to environmental information is established by Article 4.3 of the Law on Environmental Protection. Introduced in 2021, it provides a basis for demanding access to information now; it would be wrong to apply it retrospectively to events in 2019–2020.[65]
The statement “no results for treated water were found in the public domain” identifies a specific gap. It does not mean the treated water is known to be good, that measurements were never taken, or that anyone refused a request we did not send.
We need to establish who holds the results and how residents can obtain them. If the necessary measurements were not carried out, we need to establish who was responsible and why they were not done. It is unacceptable to place that burden on a family simply turning on the tap.
Illustrations and data
The maps and charts were prepared for this investigation. The subject and period covered by each numerical illustration are specified in its caption; the data tables retain links to the original sources. Missing years have not been filled by interpolation.
Satellite basemap for the two maps: EOxCloudless — EOX IT Services GmbH, Contains modified Copernicus Sentinel data 2024, annual mosaic, CC BY-NC-SA 4.0, EOX licence terms. Geographical data: GEM, published company information and © OpenStreetMap contributors. The basemap’s non-commercial licence must be respected when publishing it; commercial use requires the appropriate permission.
Data tables: production by company, production and cancer types, district, republic and Russia, all municipalities, historical congenital anomaly groups, outcomes of prenatal diagnosis.
Sources
The reference numbers apply to this article. PDF pages are counted from the start of the file; printed pagination is given separately where it differs. Russian-language source titles are translated below; the links lead to the original documents.
Nichkova I. 2021. Uranium, nitrates, sulphates: what water do people in Khakassia drink? Shans, 2 April. Article. Accounts, public explanations and restrictions on water collection.
Back to citation ↑Republic of Khakassia. State report on the environment in the Republic of Khakassia in 2021. PDF p. 34: uranium in Krasnopolye’s water source; p. 120: a separate radiation hygiene assessment. Document. A complete saved copy was used.
Back to citation ↑Pivovarova E. A., Pivovarov A. A., Kurganov V. E. 2020. Assessment of uranium concentrations in drinking water sources based on laboratory measurements of the specific activities of 238U and 234U and laboratory determination of uranium under GOST R 54499-2011. Zdorovye naseleniya i sreda obitaniya. No. 2:46–50. DOI: 10.35627/2219-5238/2020-323-2-46-50. Full text, Table 4, printed p. 49 / PDF p. 4; retrospective screening results and conclusions.
Back to citation ↑Pivovarova E. A., Pivovarov A. A. 2016. Radiation hygiene assessment of sources of domestic and drinking water supply in the Republic of Khakassia. Radiatsionnaya gigiena. 9(3):61–68. DOI: 10.21514/1998-426X-2016-9-3-61-68. Full text, PDF pp. 2, 4–6.
Back to citation ↑Pivovarova E. A., Pivovarov A. A. 2013. Results of drinking water monitoring for radiation safety indicators in the Republic of Khakassia. Sovremennaya meditsina: aktualnye voprosy. Proceedings of the XXIII International Scientific and Practical Conference. No. 9(23). Novosibirsk: SibAK. Pp. 134–138. Proceedings.
Back to citation ↑Pivovarov A. A., Pivovarova E. A., Kurganov V. E. 2019. On developing control levels for gross alpha specific activity in water samples from selected sources of centralised domestic and drinking water supply in the Republic of Khakassia. Radiatsionnaya gigiena. 12(2, special issue):121–128. DOI: 10.21514/1998-426X-2019-12-2s-121-128. Full text, Table 2, PDF p. 4 / printed p. 124.
Back to citation ↑World Health Organization. 2022. Uranium. Chemical fact sheet. Guidelines for drinking-water quality, fourth edition incorporating the first and second addenda. Official PDF, Uranium section, printed pp. 478–479. Chemical toxicity and the provisional guideline value; not a radiological dose assessment.
Back to citation ↑Engineering Centre ENKA LLC. 2014. Water supply and wastewater disposal plan for Krasnopolye Rural Council. СВВ 25/14-01. Novokuznetsk. Table 3: borehole No. 0618. Copy on the rural council’s website.
Back to citation ↑Altaisky District Administration. Update to the water supply and wastewater disposal plan for Krasnopolye Rural Council, published in 2024. The title page retains the original developer, Engineering Centre ENKA LLC, the year 2014 and document code СВВ 25/14-01. Table 3: No. 786; sections on water treatment and disinfection. DOCX.
Back to citation ↑Piskunova T. 2022. Krasnopolye will soon no longer need water deliveries. Khakassia newspaper, 3 February. Article.
Back to citation ↑Government of the Republic of Khakassia. 2022. Resolution No. 314 of 31 May on the allocation of municipal property. Appendix 3, movable property, row 1: BMS WT 5CE/S. Official document.
Back to citation ↑Commercial Court of the Republic of Khakassia. 2026. Judgment of 3 April in case А74-7838/2025. Cold water supply services provided by Impuls, the municipal treasury enterprise of Altaisky District, in the first quarter of 2025. Judgment.
Back to citation ↑Republic of Khakassia. State report on the environment in the Republic of Khakassia in 2022. PDF p. 153: social and hygienic monitoring results for 2018–2022. Document. A complete saved copy was used.
Back to citation ↑Russian Federation. Federal Law No. 416-ФЗ of 7 December 2011 on Water Supply and Wastewater Disposal, Article 25. Operational monitoring of drinking water quality. Article text. The account of current duties was checked against the version in force when the original text was prepared.
Back to citation ↑Russian Federation. Federal Law No. 416-ФЗ, Article 23. Ensuring drinking water quality; paragraphs 10–11 concern publication of information and informing the public. Article text.
Back to citation ↑Kurbatov S. M. 1925. A new deposit of uranium and vanadium compounds in Minusinsk Uyezd, Yenisei Governorate. Izvestiya Rossiyskoy akademii nauk. Series VI. 19(9–11):315–322. Full text. Account of the 1919 visit.
Back to citation ↑Presidium of the Government of the Republic of Khakassia. 2018. Resolution No. 133-п of 24 September, appendix, section 1.1 on Bogradsky District. Document. Names Primorskoye and Oglakhtinskoye. Catalogue reference for Primorskoye: record No. 1740, 1982 site record; the full displayed record could not be obtained during verification. Map coordinates and their provenance are retained separately in the map description.
Back to citation ↑MK in Khakassia. 2021. Uranium vein found near the village of Krasnopolye in Khakassia. 1 May, citing RTS. Article. Source of the report about the vein, not a geological site record.
Back to citation ↑Vergunov A. V., Arbuzov S. I., Sobolenko V. M. 2019. Mineralogy and geochemistry of tonsteins in the coals of the Beyskoye deposit, Minusinsk Basin. Izvestiya Tomskogo politekhnicheskogo universiteta. Inzhiniring georesursov. 330(2):155–166. DOI: 10.18799/24131830/2019/2/116. Full text, structure of the sequence: PDF pp. 3–4; Table 4: PDF p. 7 / printed p. 161.
Back to citation ↑Coal loading facility of Mayrykhsky Open-Pit Mine Coal Company LLC. Expansion using FGX-48A units. EIA, project 390-909-19, volume 1. PDF p. 21: non-selective extraction; PDF p. 44, §3.6: gamma survey. Document in the website archive. A previously saved copy of the project was examined.
Back to citation ↑Silantiev V. V., Arbuzov S. I. et al. 2024. First U-Pb (CA-ID-TIMS) Dating of the Uppermost Permian Coal Interval in the Minusinsk Coal Basin (Siberia, Russia) Using Zircon Grains from Volcanic Ashfalls. Minerals. 14:982. DOI: 10.3390/min14100982. Full text, PDF p. 7.
Back to citation ↑Kyrova S. A. 2005. Assessment of geoenvironmental conditions in the Abakan–Chernogorsk industrial area of the Republic of Khakassia. Dissertation abstract. Tomsk. Full text, PDF pp. 17–18, Tables 6–8: coal, ash and slag residue, and ash.
Back to citation ↑EIA for project 390-909-19, volume 2. Test report No. 965, dated 22 January 2020, coal consignment 0198. PDF pp. 34–35 / printed pp. 33–34. Document in the website archive. Both pages were examined in the saved project documentation.
Back to citation ↑U.S. Geological Survey. 1997. Radioactive Elements in Coal and Fly Ash: Abundance, Forms, and Environmental Significance. Fact Sheet FS-163-97. USGS document.
Back to citation ↑State Subsoil Monitoring. State of the geological environment (subsoil) of the Siberian Federal District in 2018. Bulletin, PDF p. 74: dewatering and infiltration; p. 76: changes in groundwater chemistry.
Back to citation ↑State Subsoil Monitoring. State of the geological environment (subsoil) of the Siberian Federal District in 2019. Bulletin, PDF p. 72: Abakansky mine, settling pond and groundwater mound.
Back to citation ↑State Subsoil Monitoring. State of the geological environment (subsoil) of the Siberian Federal District in 2020. Bulletin, PDF p. 74: Izykhsky mine.
Back to citation ↑Kuskovsky V. S. 2000. Environmental and hydrogeological characteristics of the reservoirs of the Yenisei hydropower cascade. Sibirskiy ekologicheskiy zhurnal. No. 2:215–223. Full text, printed pp. 216–217 / PDF pp. 2–3.
Back to citation ↑Irkutskgiprodornii OJSC. 2010. Spatial planning scheme for the municipality of Altaisky District. Project supporting materials. Irkutsk. Document, PDF p. 10 / printed p. 8.
Back to citation ↑Republic of Khakassia. State reports on the environment for 2016–2025. Company production figures: Table 1.5.1.5 in the reports for 2016–2022; health figures: Tables 3.2.4 / 4.2.4 / 4.2.3 in the respective editions. Every row in the production data and health comparison retains the year, full document URL and PDF page. Main editions: 2016, 2017, 2018, 2019, 2020, 2021, 2022, 2023, 2024. The 2025 edition is source 34.
Back to citation ↑Meshkov G. B., Petrenko I. E., Gubanov D. A. 2024. Results of the Russian coal industry’s performance in 2023. Ugol. No. 3:18–29. DOI: 10.18796/0041-5790-2024-3-18-29. Article: PDF p. 20. Journal issue, PDF p. 23 / printed p. 21, table of the largest producers.
Back to citation ↑Russian Coal JSC. 2024. Russian Coal introduces an automated dispatch system at a mine in Khakassia. 11 January. Kirbinsky’s 2023 result. For the previous year: Russian Coal increased fuel production at Kirbinsky mine in Khakassia by 24% in 2022. Gornaya promyshlennost, 16 January 2023. Article.
Back to citation ↑Coal center analytics / EastRussia. 2024. Coal Pulse, 17 June: the coal industry at the present moment. Article, paragraph on Mayrykhsky’s production in 2023.
Back to citation ↑Republic of Khakassia. State report on the environment in the Republic of Khakassia in 2025. PDF. Production: PDF p. 82; genitourinary diseases: Table 4.2.3, PDF p. 151.
Back to citation ↑Piskunova T. 2021. A medical team is working in “uranium” Krasnopolye. Khakassia newspaper, 22 April. Article. A report of the team’s work, not a final report on the examinations.
Back to citation ↑Rosstat. Healthcare in Russia. Editions for 2017, 2019, 2021, 2025. Table 2.1; PDF p. 31 / printed p. 30 in the first three editions, PDF p. 29 / printed p. 28 in the 2025 edition. Years and unit conversions are recorded in the comparison table.
Back to citation ↑Ministry of Health of the Republic of Khakassia. 2026. Updated regional programme “Combating Cancer”. DOCX. Table 2: municipal indicators; Tables 3 and 3.2: the republic and individual cancer sites; Table 10: mortality.
Back to citation ↑Kaprin A. D., Starinsky V. V., Shakhzadova A. O., Zolotarev N. Yu., eds. 2025. Malignant neoplasms in Russia in 2024 (incidence). Moscow: P. A. Herzen Moscow Oncology Research Institute. PDF, Table 5, PDF p. 23, Russia, both sexes, crude rates.
Back to citation ↑P. A. Herzen Moscow Oncology Research Institute. The state of cancer care in Russia in 2025. PDF, PDF p. 4. Description of the calculation of the 2025 rate.
Back to citation ↑Ministry of Health of the Republic of Khakassia. 2025. Regional programme “Combating Cancer”, material posted on 22 May in the section for independent review of draft regulatory legal acts. Official page with the text, Table 2, municipal indicators for 2015–2024 from reporting form No. 7. The material was published as a draft regulatory legal act.
Back to citation ↑Zhuikova L. D., Choynzonov E. L., Ananina O. A., Odintsova I. N. 2019. Cancer incidence in the Siberian and Far Eastern federal districts. Sibirskiy onkologicheskiy zhurnal. 18(6):5–11. DOI: 10.21294/1814-4861-2019-18-6-5-11. Full text, Table 1, PDF p. 4 / printed p. 8.
Back to citation ↑Alekseeva G. N., Pisareva L. F., Gurina L. I., Cherdyntseva N. V. 2021. Epidemiology of kidney cancer in Siberia and the Far East. Tomsk: Tomsk University Press. 296 pp. ISBN 978-5-7511-2632-2. Monograph, pp. 77 and 81, Tables 12 and 14.
Back to citation ↑Chernenko O. N., Borisov O. V., Dykhno Yu. A. 2017. Comparative analysis of breast cancer incidence among urban and rural women in the Republic of Khakassia. Rossiyskiy onkologicheskiy zhurnal. 22(6):335–339. DOI: 10.18821/1028-9984-2017-22-6-335-339. Full text, PDF p. 2 / printed p. 336.
Back to citation ↑Zhuikova L. D., Choynzonov E. L., Ananina O. A., Pikalova L. V., Odintsova I. N., Kononova G. A. 2021. Incidence of malignant neoplasms of the brain and other parts of the central nervous system (C70–C72) in Siberia and the Far East. Opukholi golovy i shei. 11(4):64–72. DOI: 10.17650/2222-1468-2021-11-4-64-72. Full text, Table 1, PDF p. 5 / printed p. 68.
Back to citation ↑Zhuikova L. D. et al. 2024. Problems in monitoring malignant neoplasms of the central nervous system in the Siberian Federal District and ways to address them. Voprosy neirokhirurgii imeni N. N. Burdenko. 88(5):14–22. DOI: 10.17116/neiro20248805114. Publisher’s text and tables, Tables 1 and 3.
Back to citation ↑Maksimov M. O. 2017. Patterns of lymphatic metastasis and surgical strategy in locally advanced proximal gastric cancer. Abstract of a Candidate of Medical Sciences dissertation. Tomsk. 24 pp. Full text, p. 11.
Back to citation ↑Starodubov V. I., Stupak V. S., Manoshkina E. M., Son I. M. 2021. Trends in morbidity and in-hospital mortality from neoplasms before and during the COVID-19 pandemic. Vestnik Rossiyskoy akademii meditsinskikh nauk. 76(6):612–621. DOI: 10.15690/vramn1648. Full text, PDF p. 8 / printed p. 619.
Back to citation ↑Minaycheva L. I. 2014. Genetic and epidemiological study of congenital anomalies in Siberian populations: monitoring, clinical genetic counselling and follow-up care. Doctor of Medical Sciences dissertation. Tomsk. Full text. Pp. 82–85: study material; pp. 94–95, Table 14: frequencies by group.
Back to citation ↑Presidium of the Government of the Republic of Khakassia. 2022. Resolution No. 214-п of 14 December approving the regional programme of the Republic of Khakassia “Provision of Expanded Neonatal Screening”. Official text, §1.2, Table 4 and the subsequent analysis of causes of infant deaths.
Back to citation ↑Government of the Republic of Khakassia. 2015. Resolution No. 527 of 16 October, amendments to the healthcare modernisation programme. Official text, passages beginning “In 2012…” and “In the first 9 months of 2013…” on prenatal diagnosis and terminations.
Back to citation ↑Yin S. et al. 2022. Prenatal uranium exposure and risk for fetal neural tube defects: A case-control study in women living in a rural area of northern China. Journal of Hazardous Materials. 424(Pt B):127466. DOI: 10.1016/j.jhazmat.2021.127466. PubMed, PMID 34653865. The abstract is cited.
Back to citation ↑Ouattara B. S., Zahid M., Rahman F. I., Weber K. A., Bartelt-Hunt S. L., Rogan E. G. 2022. Investigation of a Possible Relationship between Anthropogenic and Geogenic Water Contaminants and Birth Defects Occurrence in Rural Nebraska. Water. 14:2289. DOI: 10.3390/w14152289. Full text, PDF p. 4: periods covered; p. 11, Table 5: models; p. 12: discussion.
Back to citation ↑International Atomic Energy Agency. Radiation protection of pregnant women in radiology. Official page, section “Effects of radiation exposure in utero”. Used to explain how the effects of radiation exposure depend on dose and stage of pregnancy, not as a drinking water standard.
Back to citation ↑Demikova N. S., Putintsev A. N. 2023. Descriptive epidemiology of multiple congenital anomalies based on congenital anomaly monitoring data for 2011–2020. Meditsinskaya genetika. 22(5):32–39. Full text, list of participating registries: PDF pp. 1–3.
Back to citation ↑Agarkov N. M., Fabrikantov O. L., Emelyanov S. G., Titov A. A., Alymova M. V., Shorokhova A. A. 2025. Trends and forecasting of infant and perinatal mortality in the republics of Tuva and Khakassia and in Mongolia. Novye issledovaniya Tuvy. No. 2. Full text. Cited here for its subject and geographical coverage; numerical forecasts have not been reproduced in this article.
Back to citation ↑Commercial Court of the Republic of Khakassia. 2025. Judgment of 1 September in case А74-12368/2024. Mayrykhsky — Mezhregiontop; contract No. 115-2022 and supplies. Judgment.
Back to citation ↑Mayrykhsky Open-Pit Mine Coal Company LLC. CSTI visits Mayrykhsky mine. The company’s own report. Publication. The date of access is not treated as the date of the visit.
Back to citation ↑Republic of Cyprus, Official Gazette. Issue No. 4450 of 7 July 2023, PDF p. 107 / printed p. 1221: renaming of HE380523; issue No. 5608 of 20 February 2026, PDF p. 49 / printed p. 1349, notices 938–939: resolution of 28 January 2026 on voluntary liquidation. 2023 gazette, 2026 gazette.
Back to citation ↑Case А40-272558/2024, BX Energy Limited — Stepnoy Open-Pit Mine Coal Company JSC. Operative part of the Moscow Commercial Court’s judgment of 18 June 2025; ruling of the Supreme Court of the Russian Federation of 29 May 2026, No. 305-ЭС26-3861. Contract date: 28 October 2021.
Back to citation ↑Barnaul Generation JSC. 2017. ТР 38752107-2017. Ash and slag materials from Barnaul CHP-2. Technical operating regulations on the SGC website, PDF p. 8, section 3.
Back to citation ↑OGK-2. Annual report for 2013. English version, PDF p. 10, spread of printed pp. 15–16; suppliers to Cherepovets GRES power station.
Back to citation ↑Two different levels of evidence concerning NCSC. Trademo: Mayrykhsky trade profile, a buyer index, not an original declaration. Israel Electric Corporation: Financial Reports, December 31, 2023, report, PDF p. 316, Note 11: supplies to Orot Rabin and Rutenberg; PDF p. 35: countries of purchase.
Back to citation ↑Russian Federation. Federal Law No. 323-ФЗ of 21 November 2011 on the Fundamentals of Health Protection of Citizens in the Russian Federation, Article 79. Part 1, point 4: medical confidentiality; points 11–12: medical documentation, reporting, record-keeping and storage. Article text.
Back to citation ↑Government of the Republic of Khakassia. 2023. Resolution No. 606 of 1 August. Plot 19:04:070403:315, heavy machinery site, 10.9 km south-west of Krasnopolye. Document. Distances between the representative village point and catalogue mine locations: calculation and original coordinates, using GEM and the published Kirbinsky location.
Back to citation ↑Russian Federation. Federal Law No. 7-ФЗ of 10 January 2002 on Environmental Protection, Article 4.3. Information on the state of the environment. Article text. The article was introduced by Federal Law No. 39-ФЗ of 9 March 2021.
Back to citation ↑